
CIO Chartbook: Inflection Point?
Editor: Yao Wang | Nicolas Sioné

Welcome to the first edition of the CIO Chartbook, which aims to rationalize key developments of the global economy in an easy-to-digest visual manner.
This month, we will take you through:
- The moderating inflation trend in the US
- The peaking Fed tightening
- The implication on asset prices
- Random musings

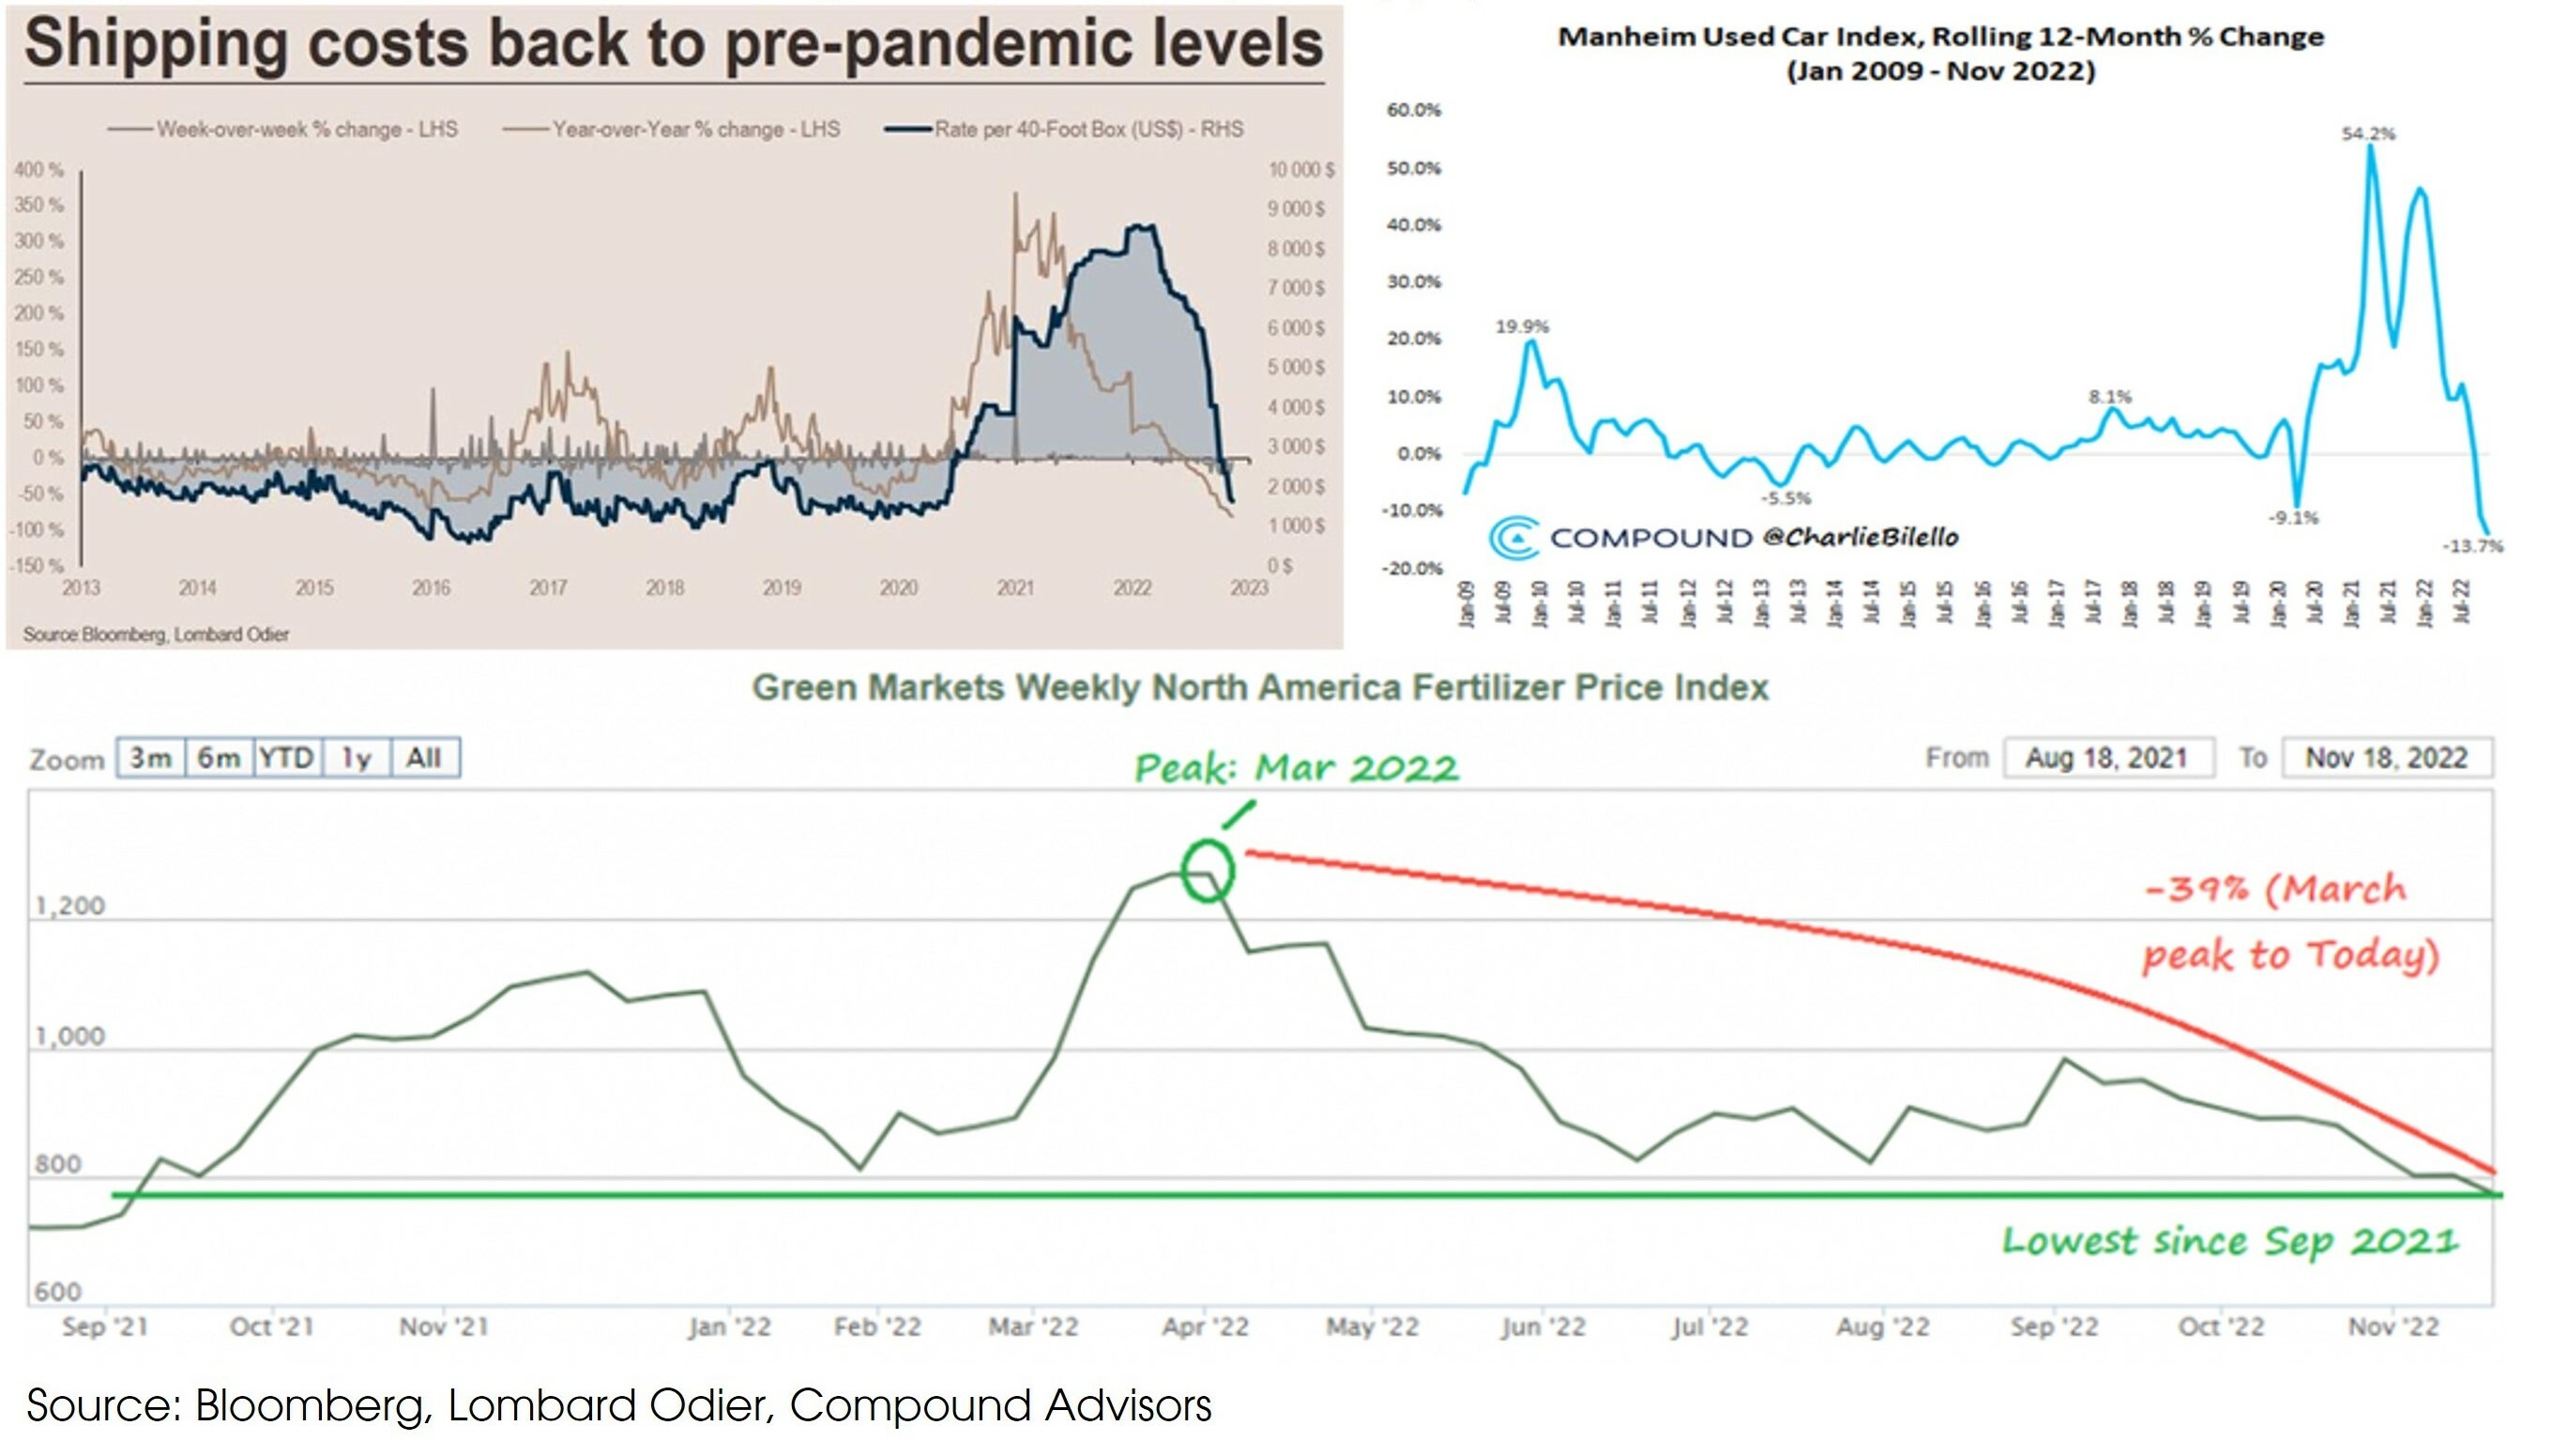
- The world is normalizing from the pandemic and war-related shocks. Prices that have increased the most within the core inflation (i.e., inflation excluding food and energy prices) swiftly retraced.
- Shipping costs are already back to the pre-pandemic levels. Prices of used cars have started falling since early 2022, as new car production gradually ramped up. Fertilizer prices have also normalized after March’s peak.
Chart 1. The world is normalizing from the multiple
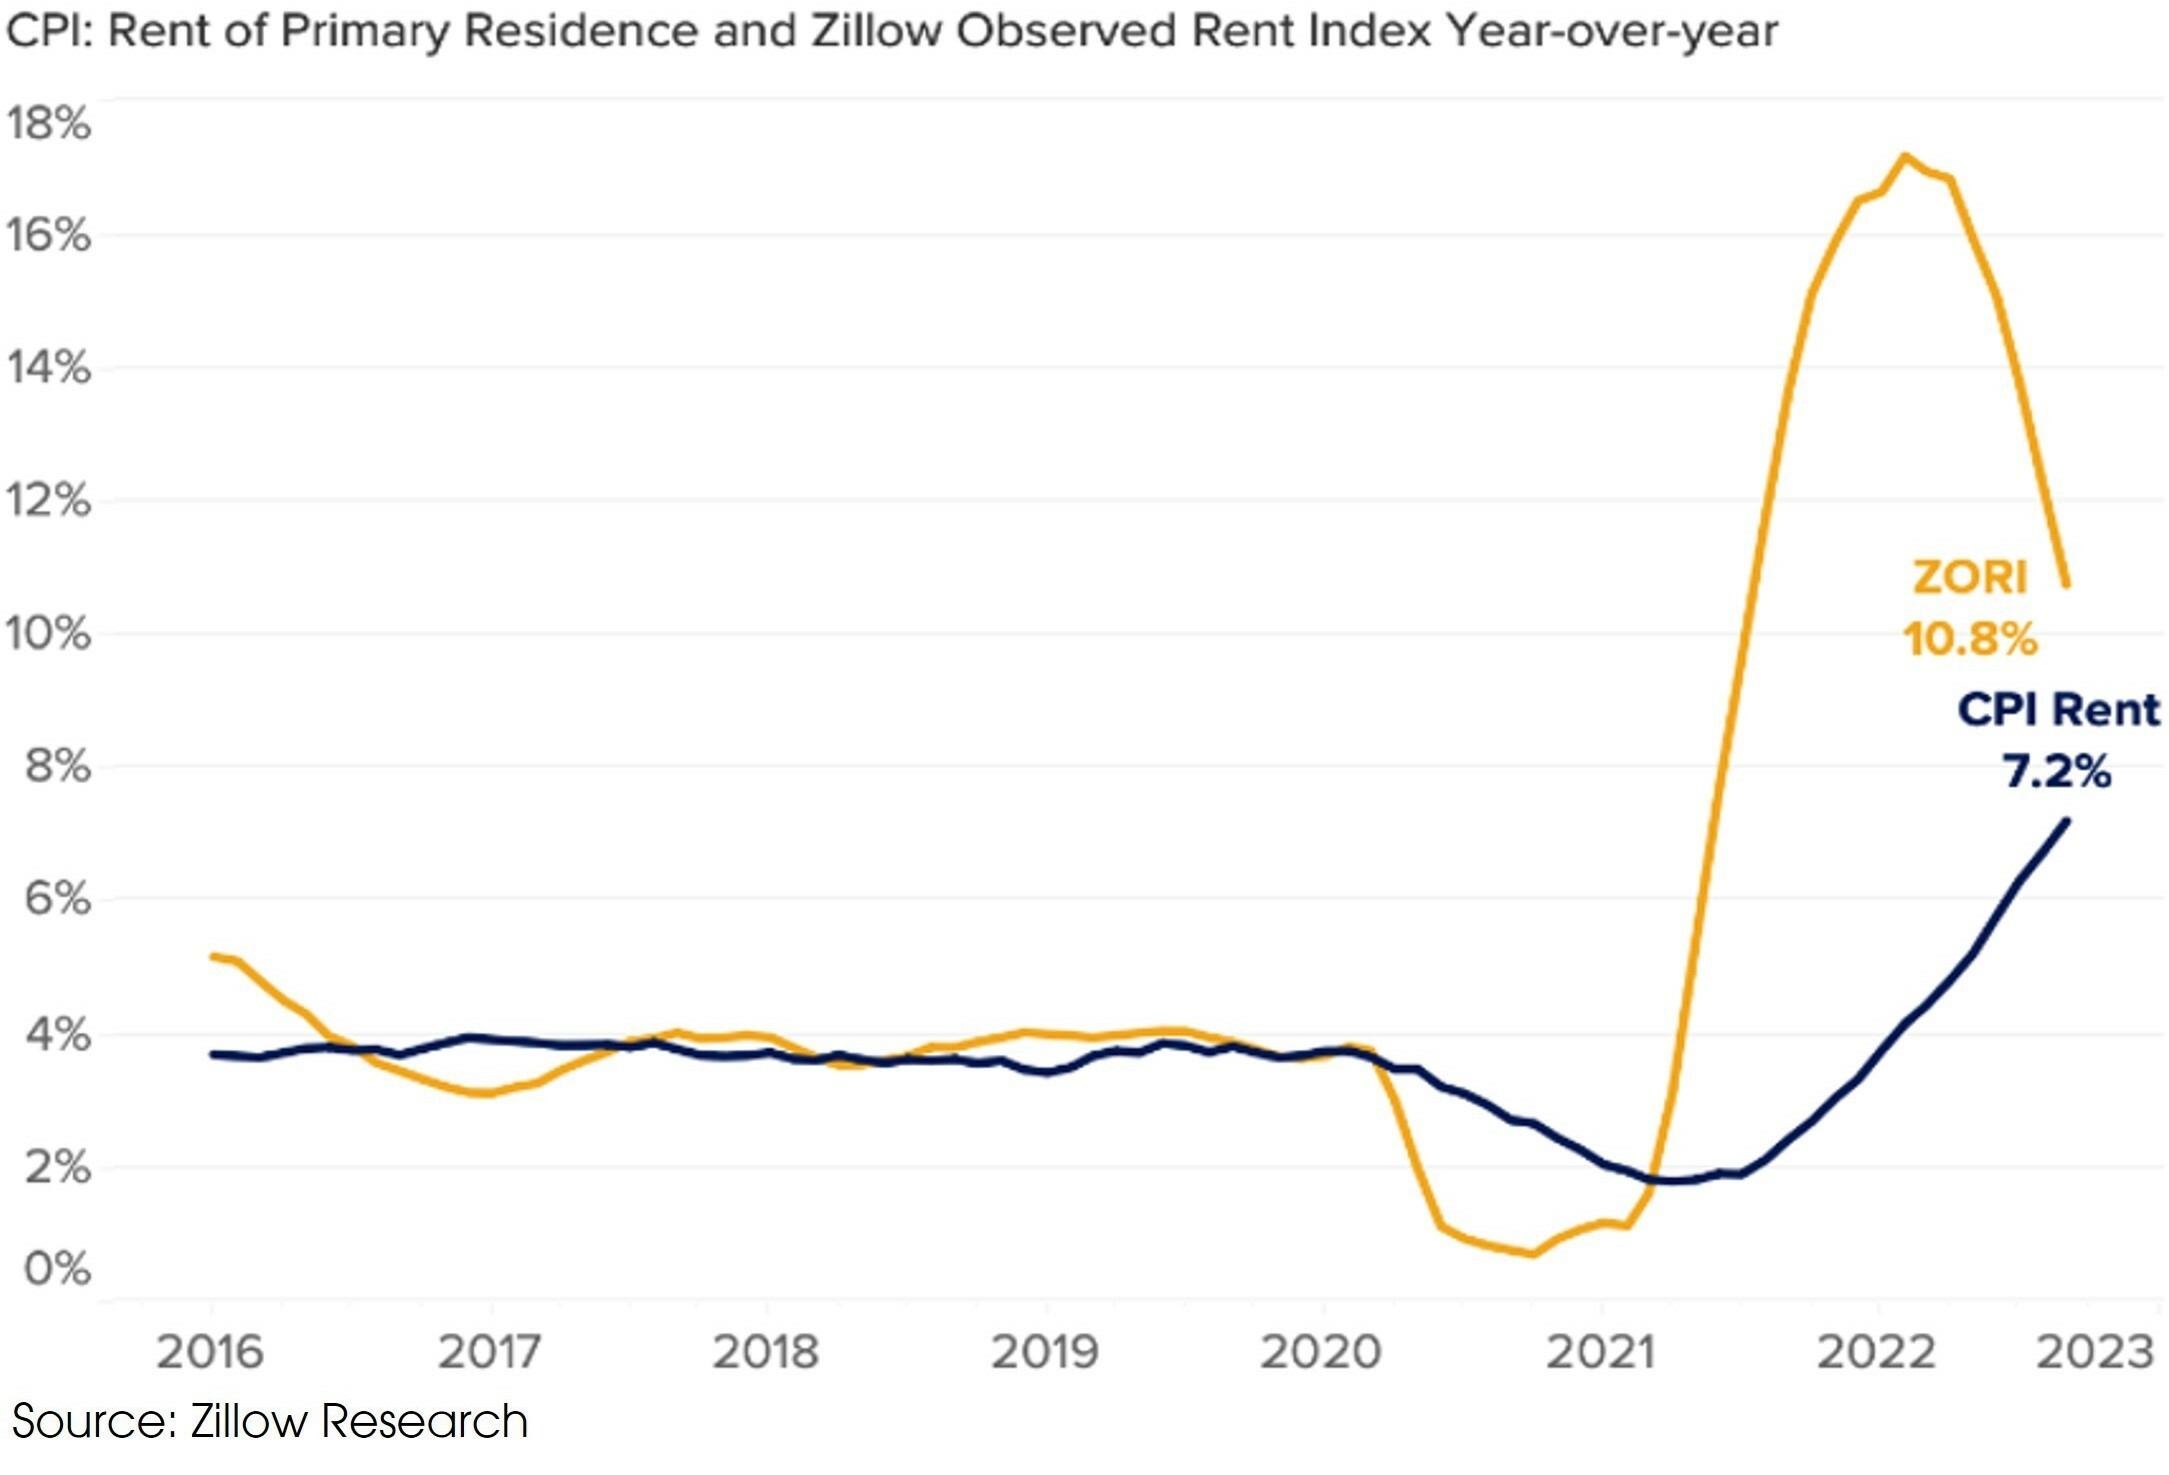
- Sticky shelter inflation has kept overall inflation high in the US, but the rent component within the CPI is a lagging measure of the real-world rent movement. According to the Fed, the Zillow Observed Rent Index (ZORI, which includes the rent of new listings) leads the rent component of the CPI, by around 12 months.
- ZORI has peaked and started to fall in 1Q 2022, as the US housing market weakened. February 2023 is a natural candidate for the most likely turning point in CPI rent inflation.
Chart 2. Rent Inflation tends to lag the Zillow Observed Rent Index
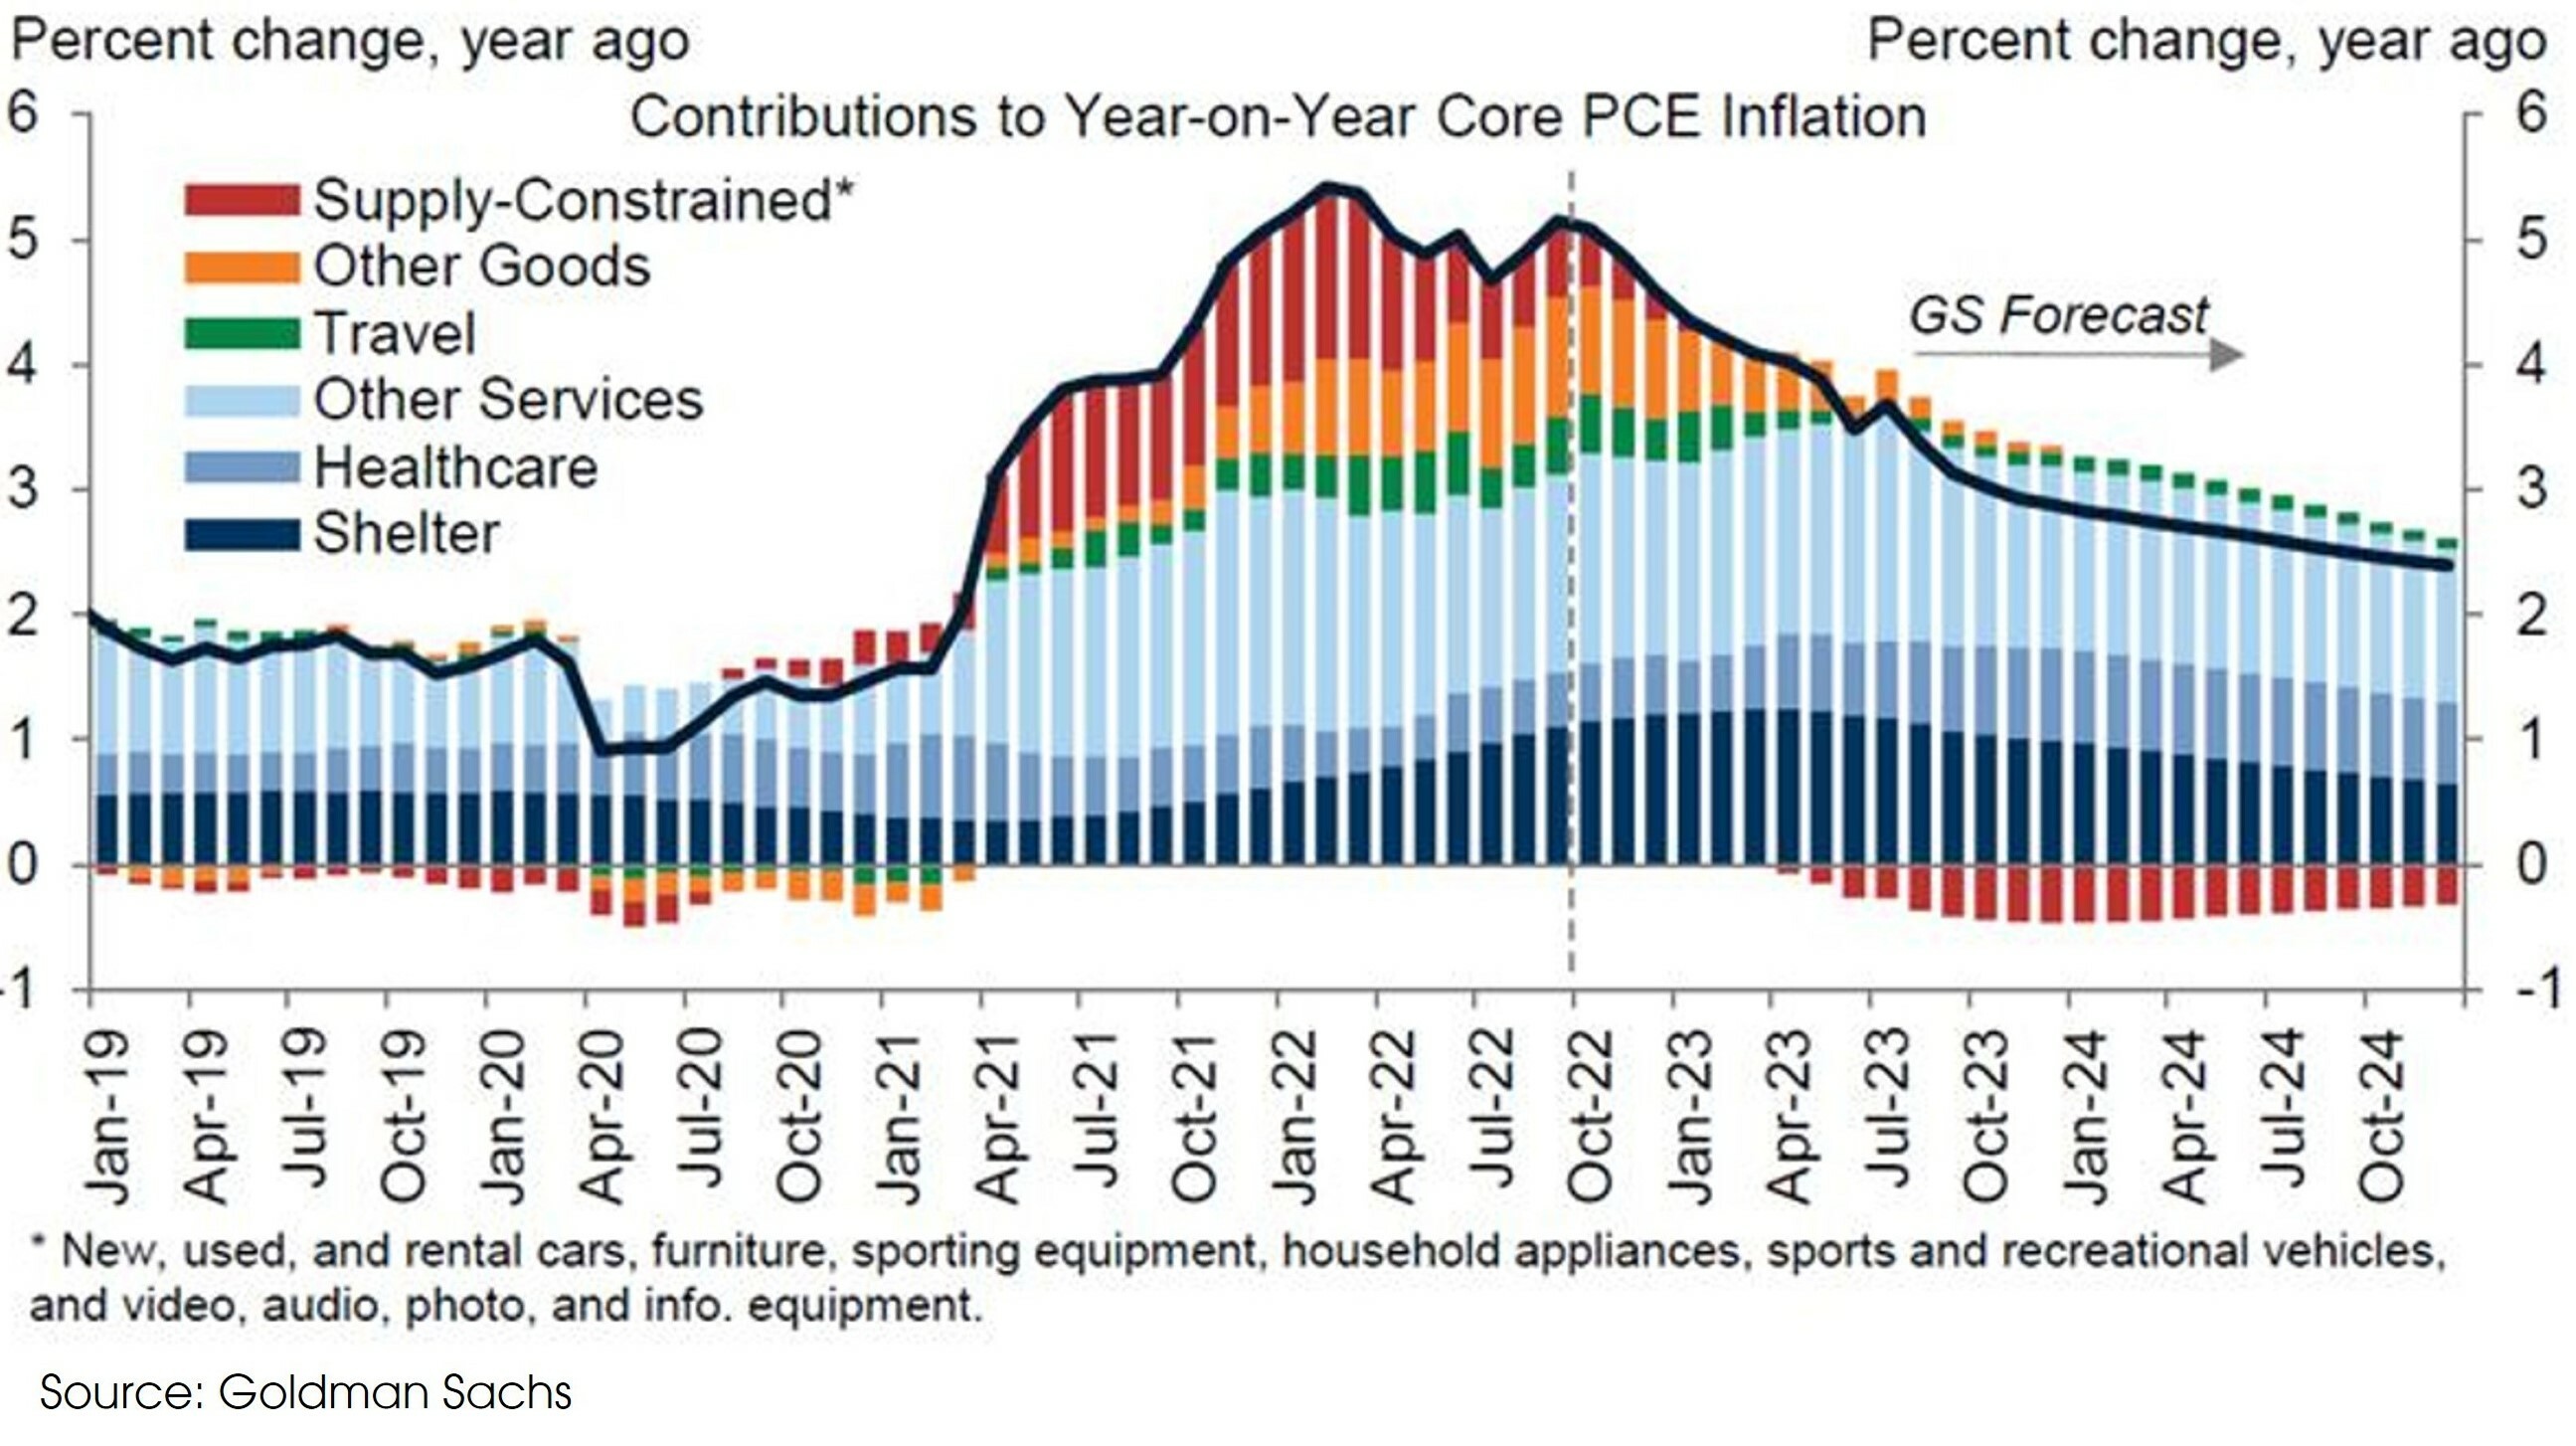
- The core PCE inflation is expected to fall, driven by moderating goods inflation, especially the ones related to supply shocks (red and orange bars).
- Based on historical data, inflation does not form a round top: Once it peaks out, it tends to fall rapidly. It has taken 16 months for CPI inflation to rise from 1.7% in February 2021 to 9% in June 2022. We may see inflation fall back to 2% by the end of 2023 or early 2024.
Chart 3. Core PCE Inflation is on a declining trend which may fall below 3% by end-2023

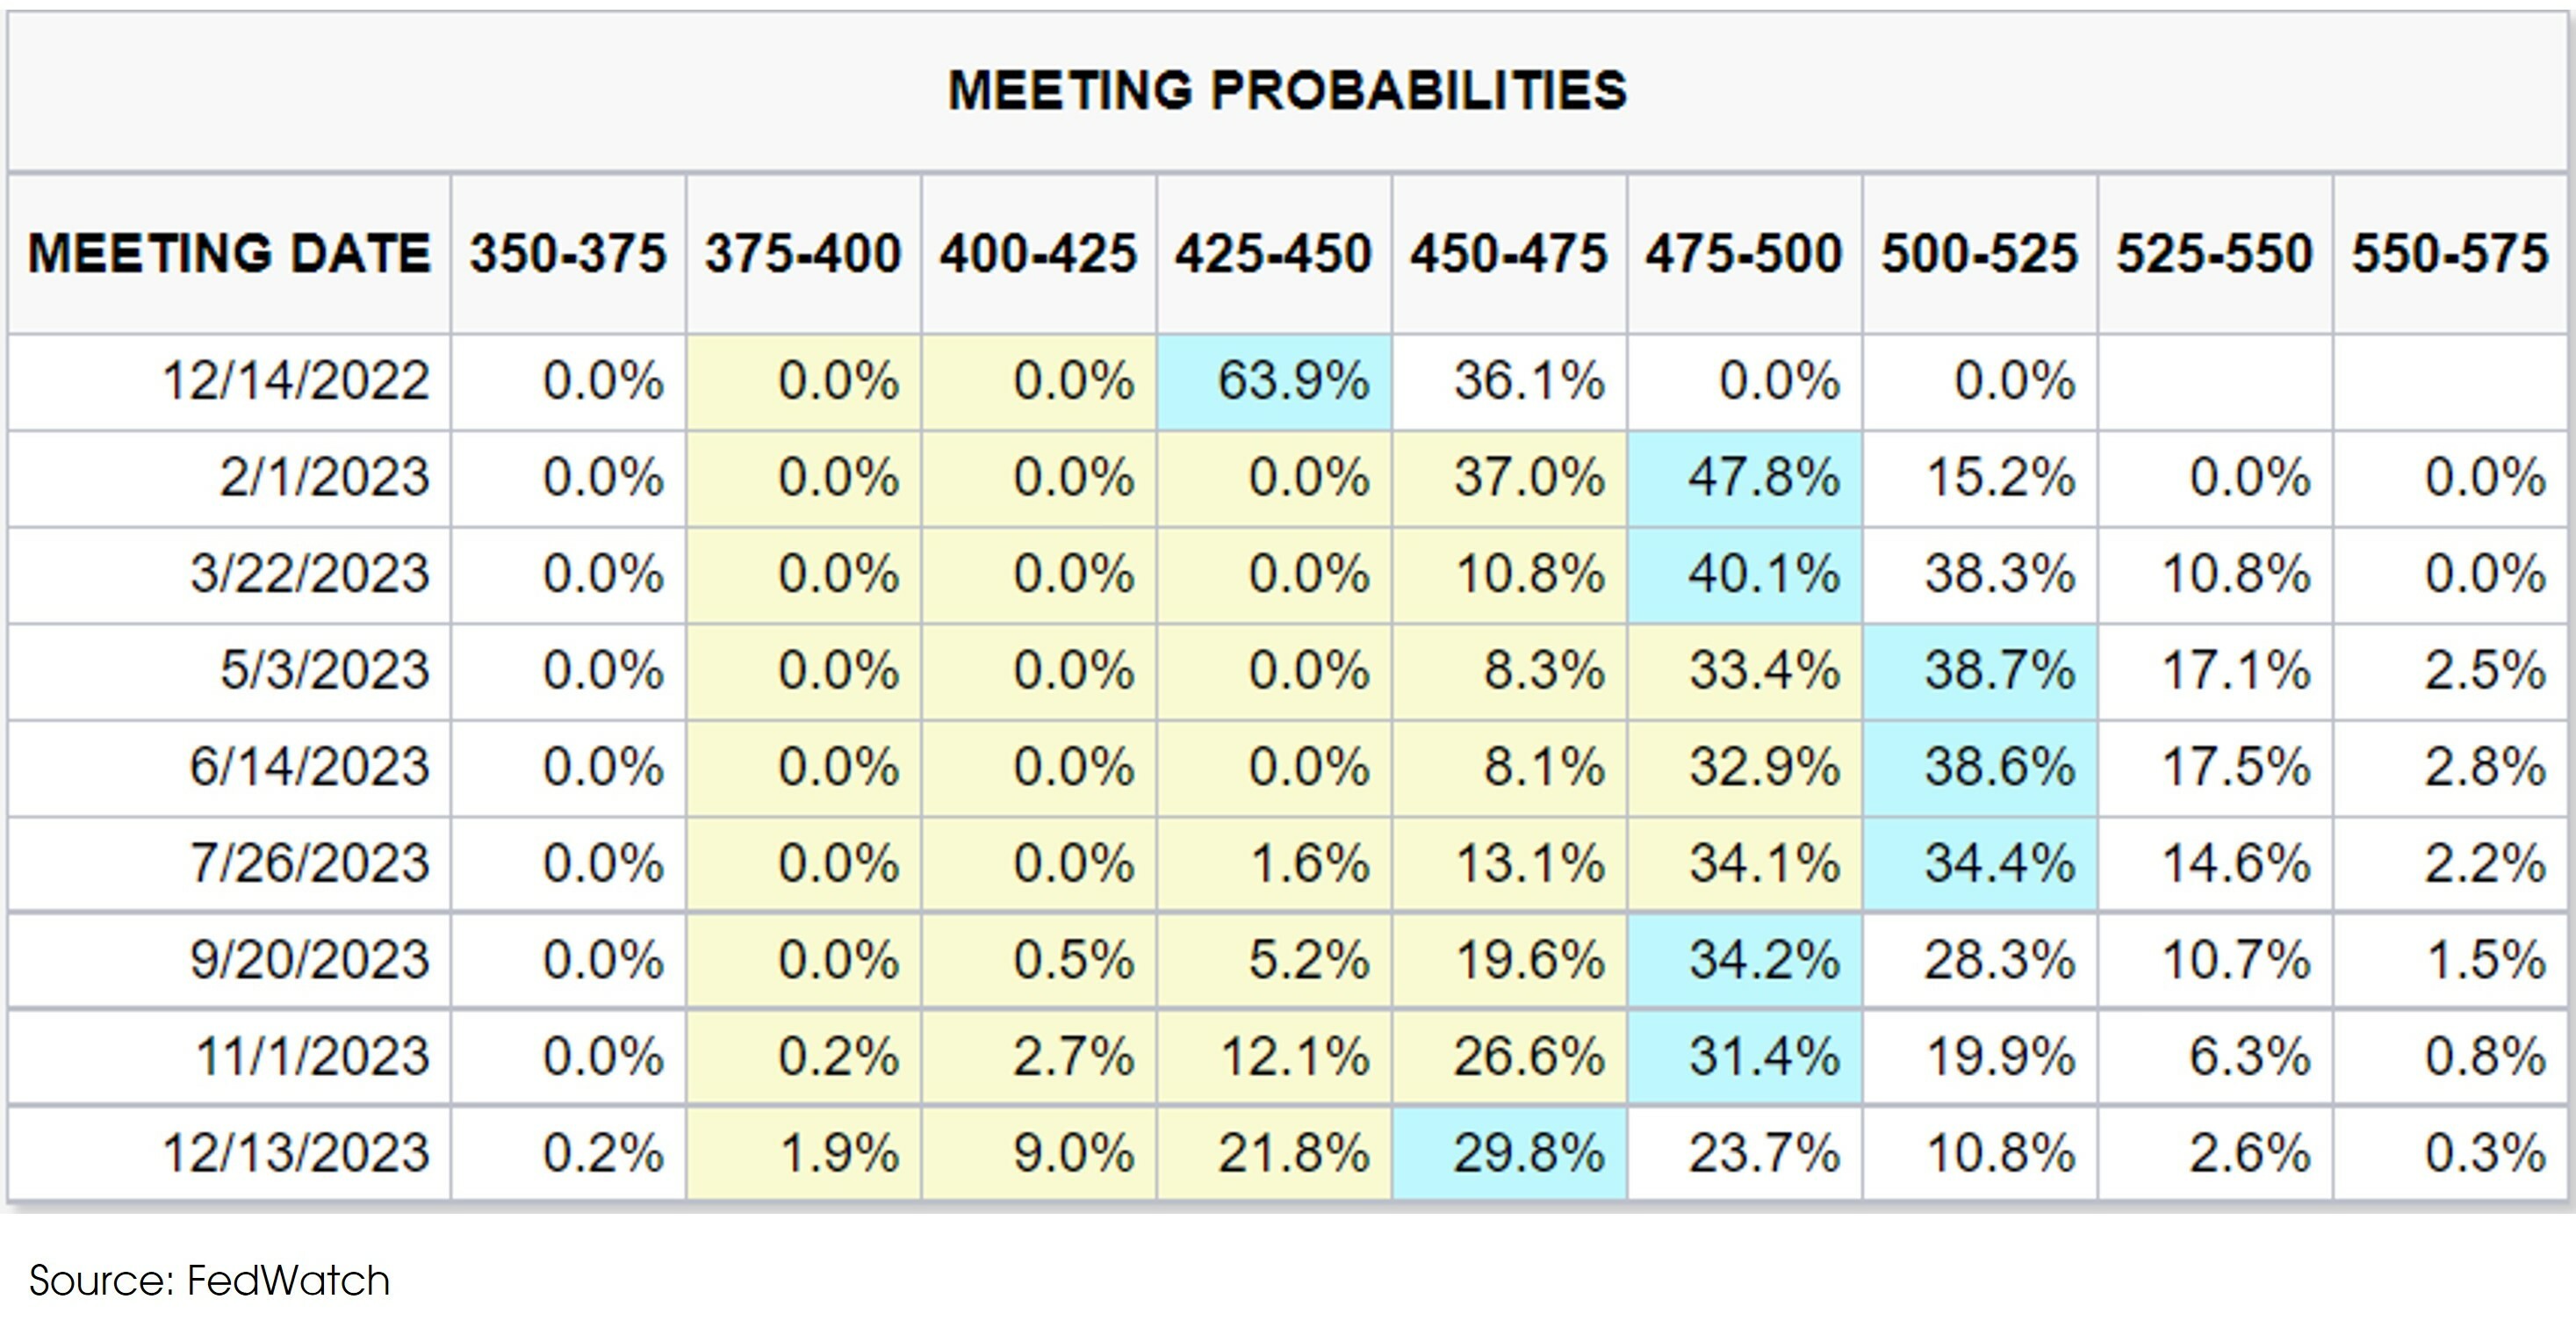
- Given the moderating inflation trend, the Fed may stop hiking when the Federal Funds Rate reaches 5-5.25%, as implicated by the futures market.
Chart 4. Futures market predicts the terminal rate at 5.00-5.25%
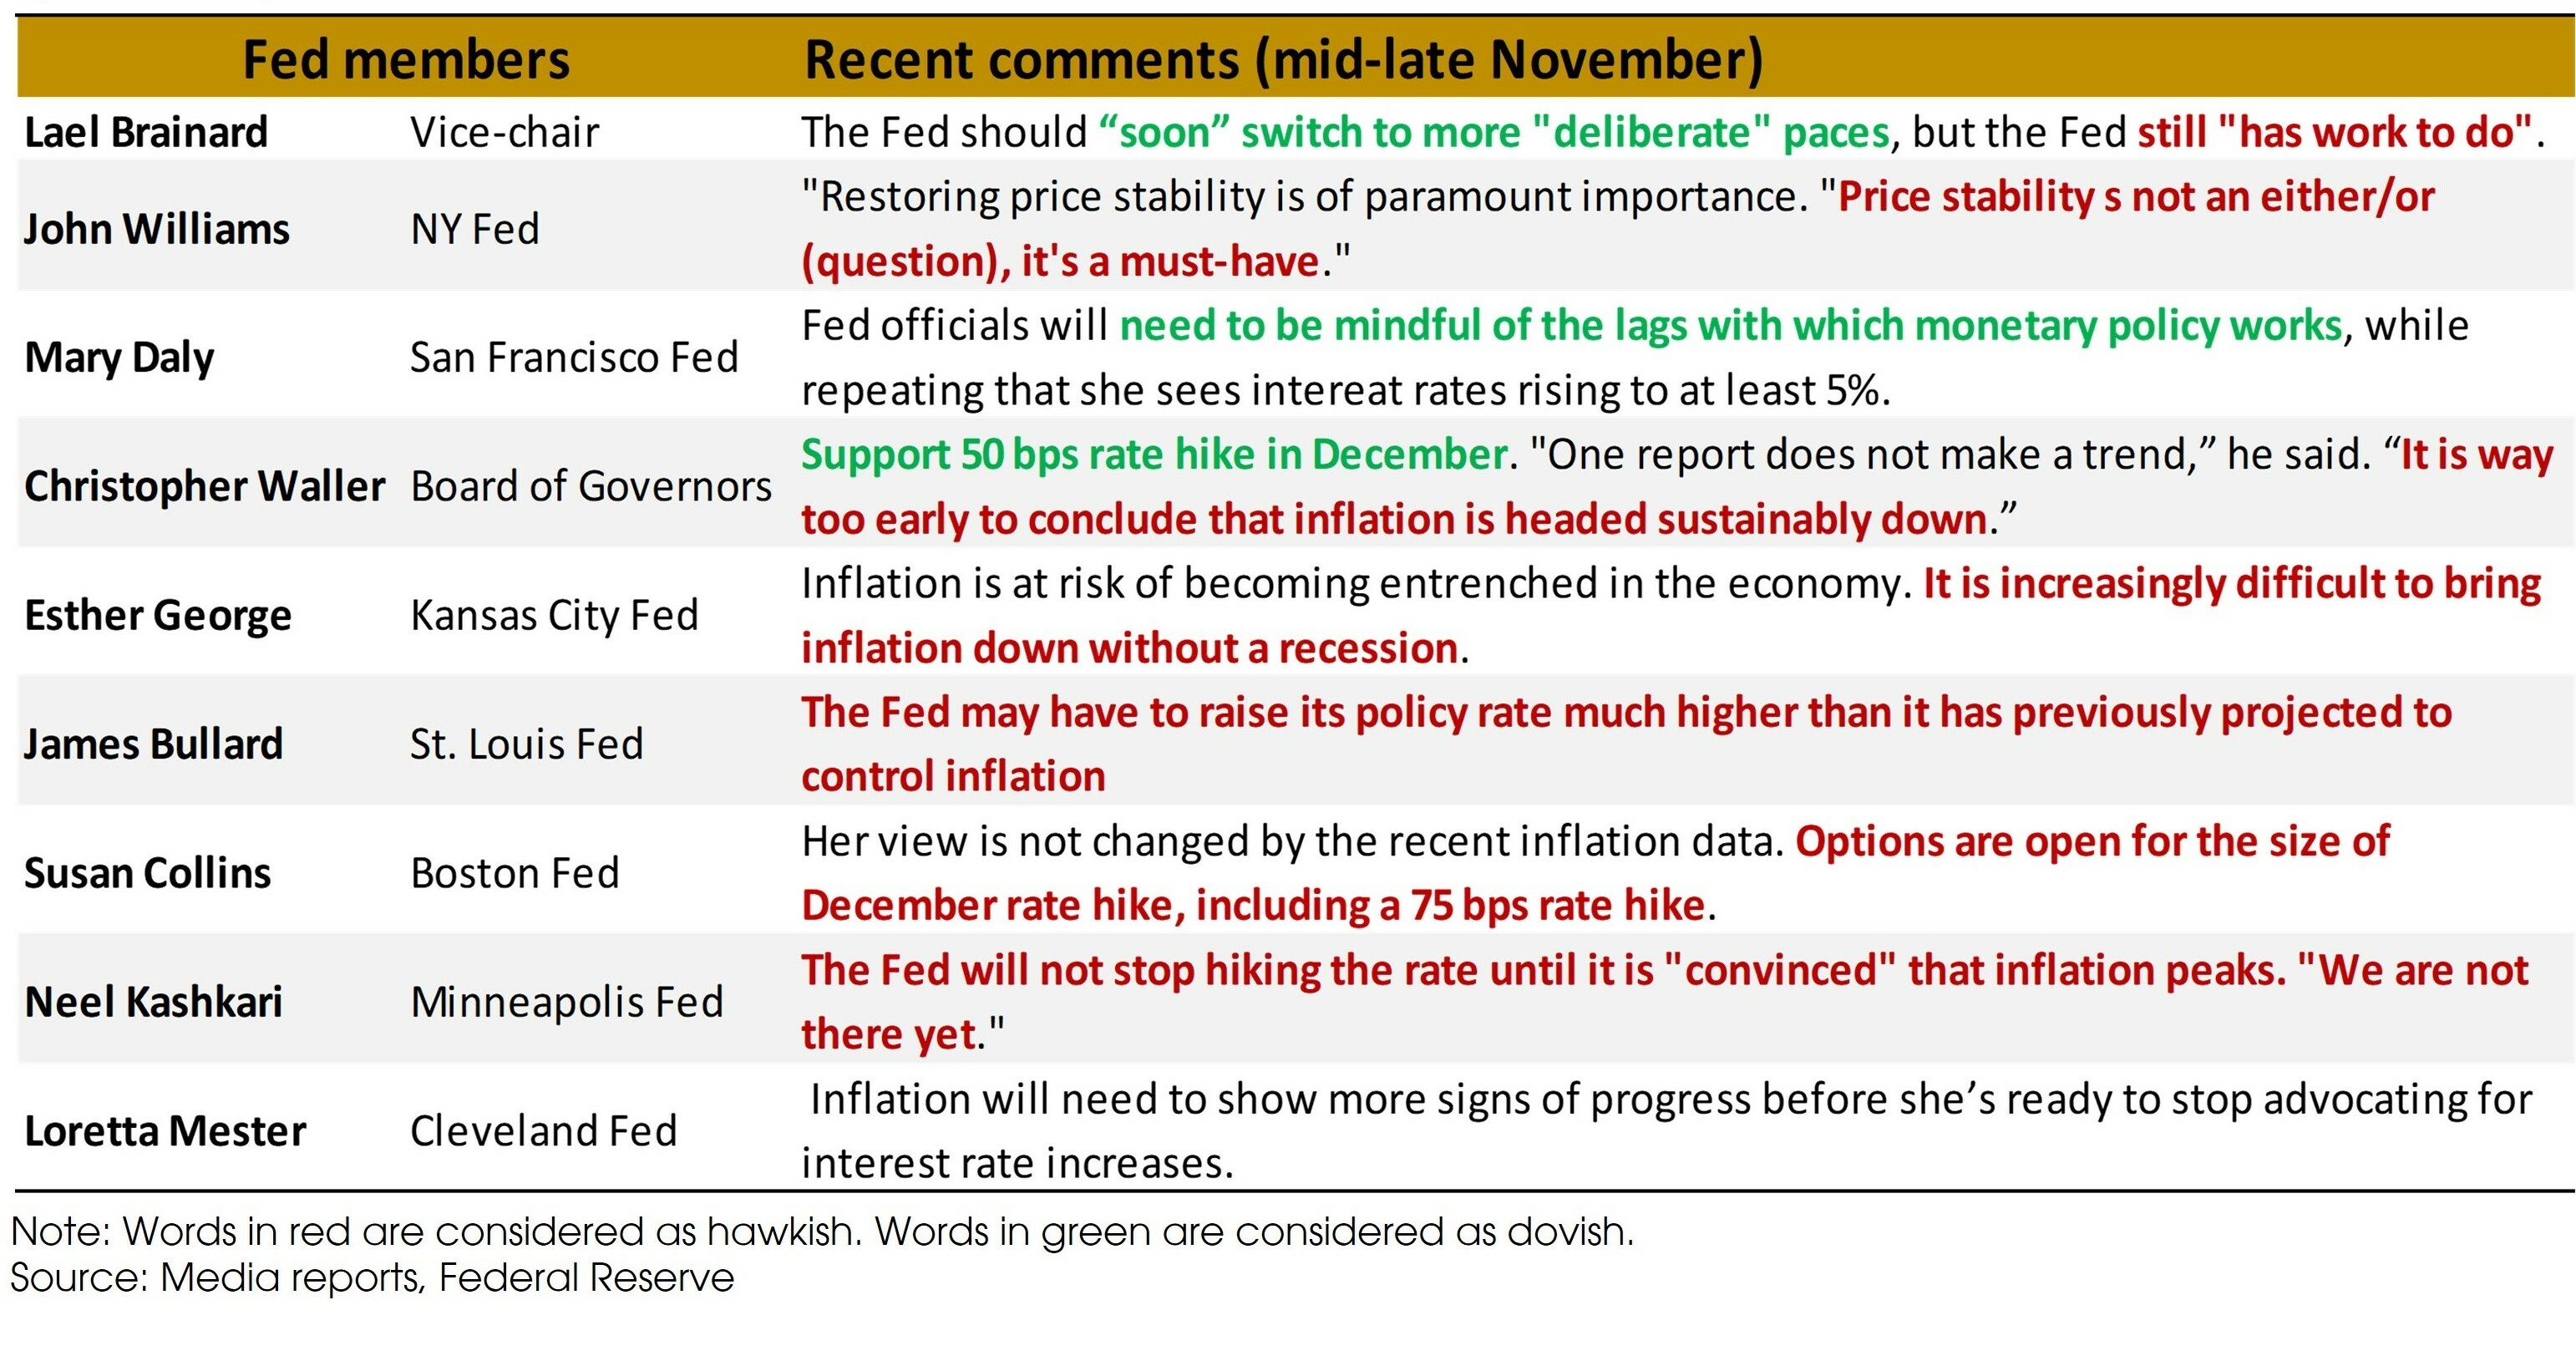
- There are however some lingering risks of over-hiking from the Fed. Fed members recently seem to acknowledge the progress in inflation and most of them support a smaller rate hike in December, but also indicate that one CPI data is not enough to mark a changing trend.
Chart 5. Many Fed members acknowledge the inflation progress but are not yet talking about a potential pause in rate hikes

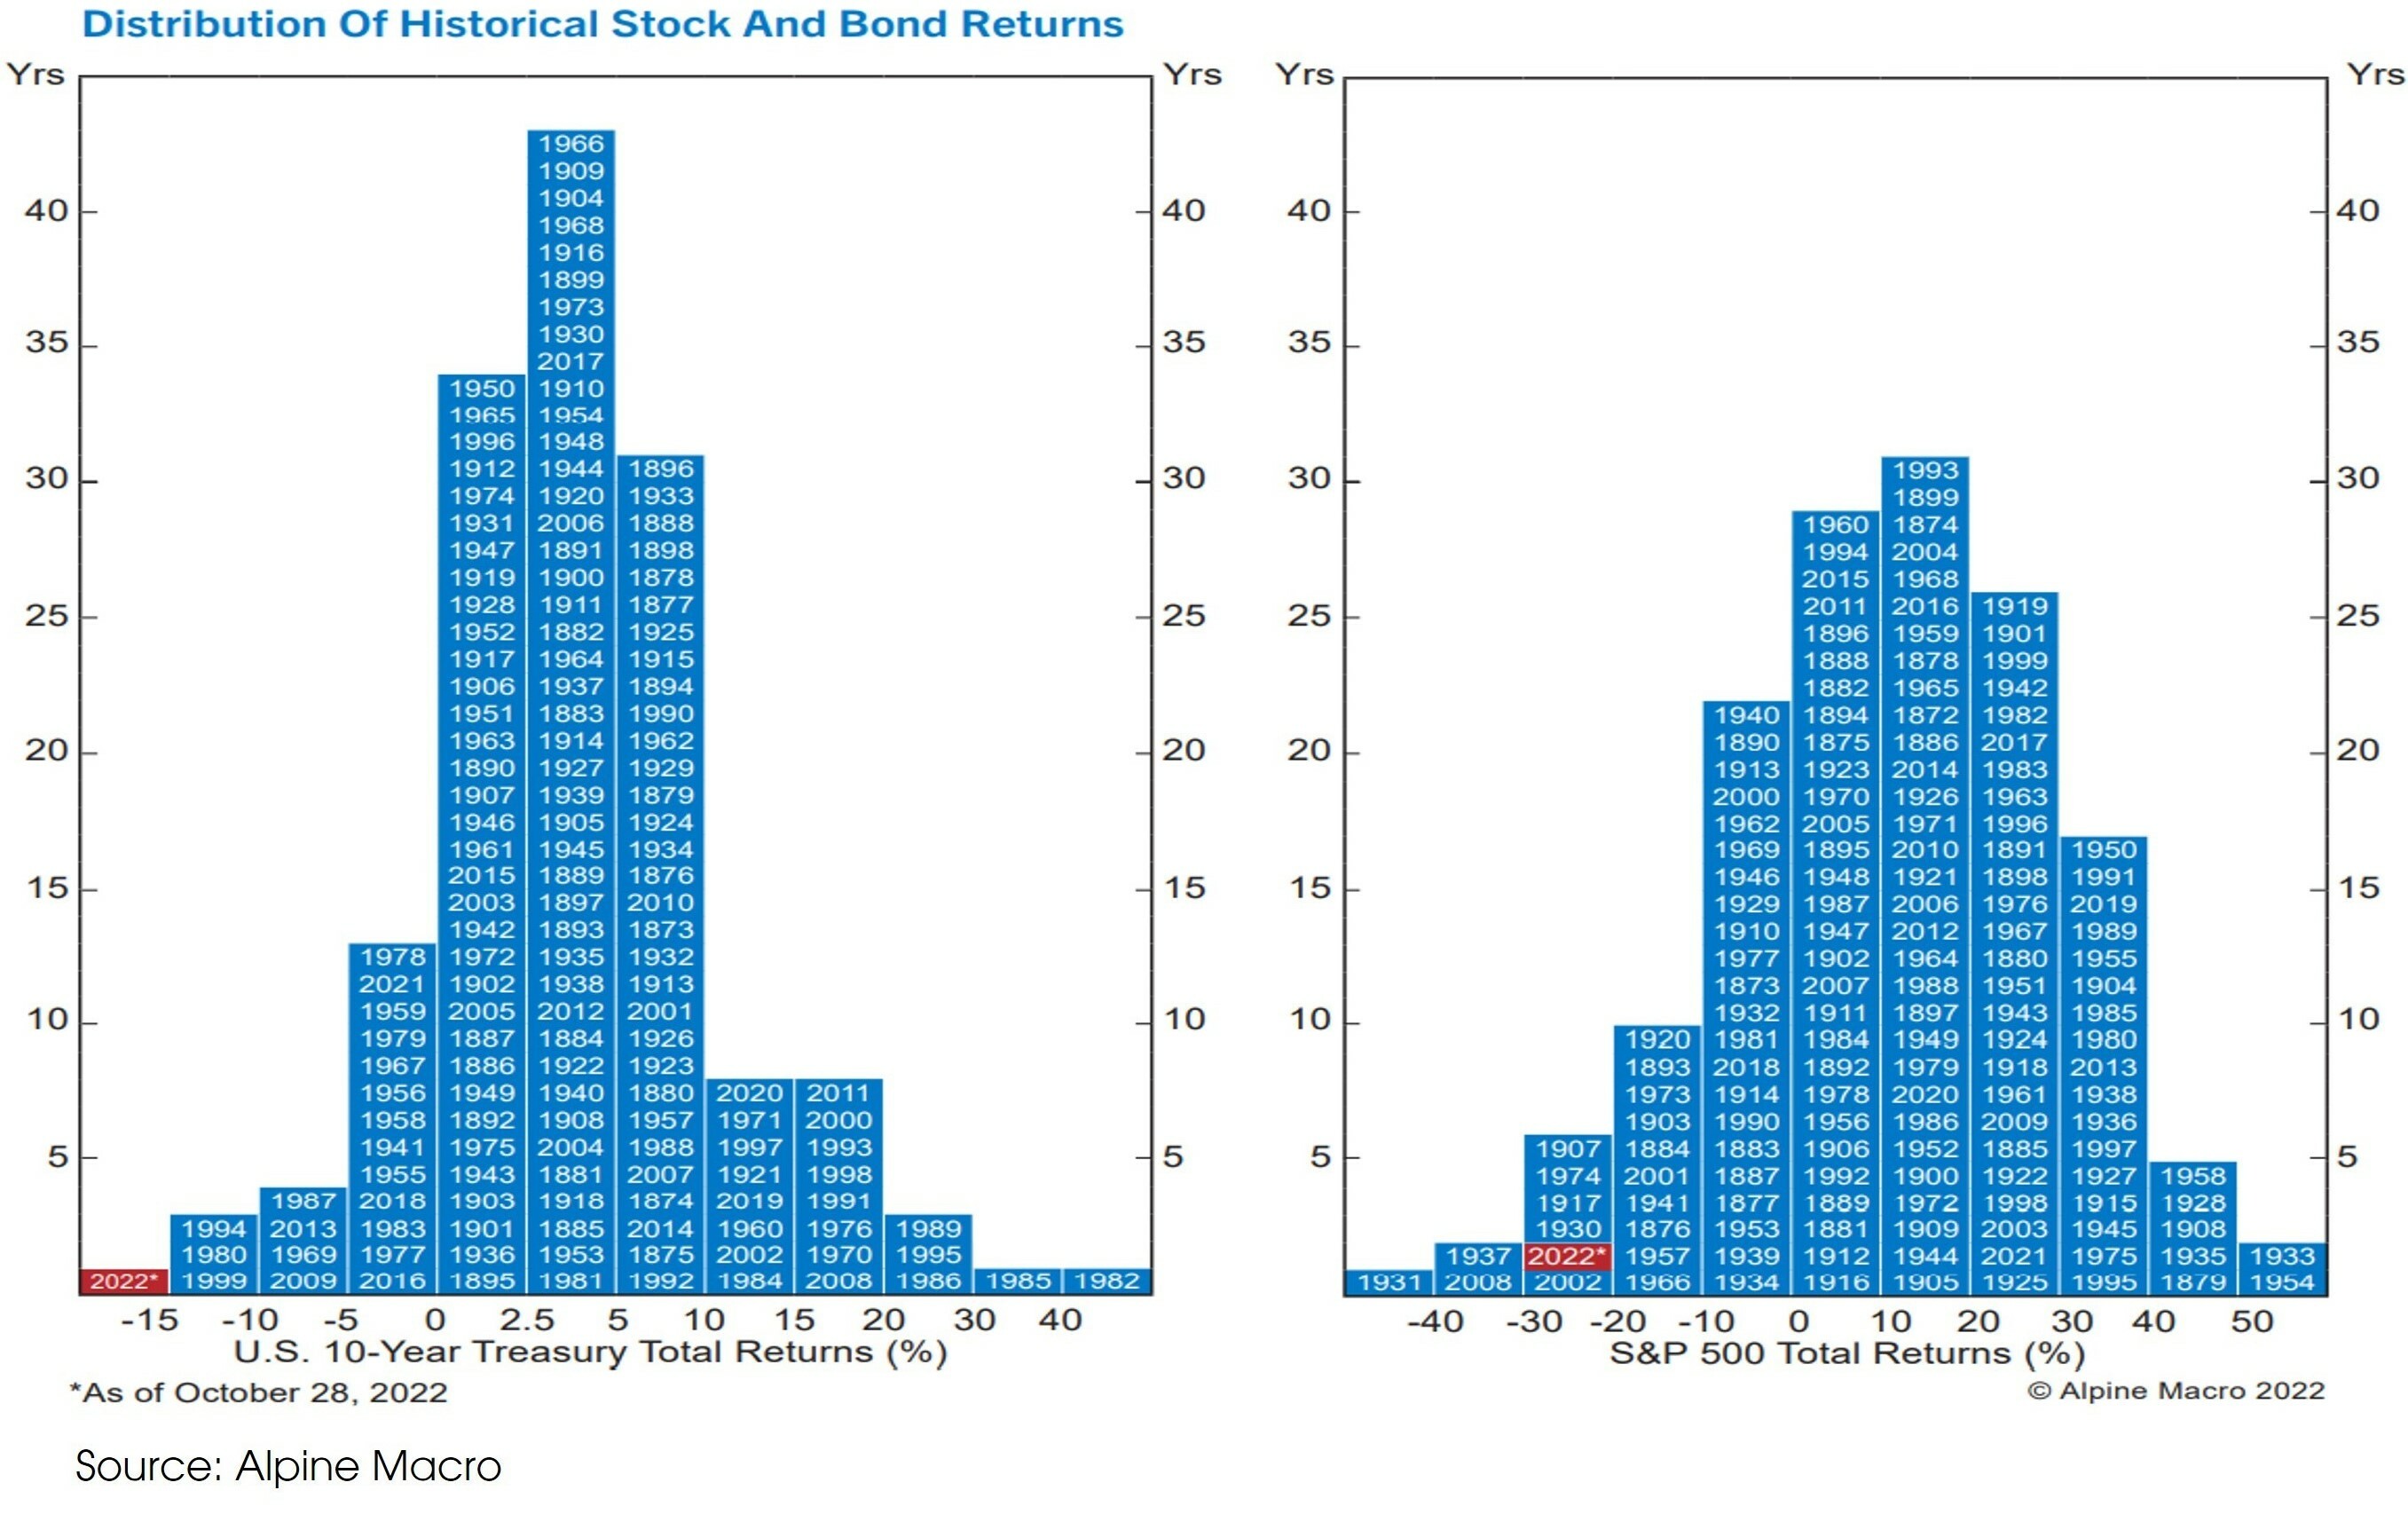
- Surging inflation and rising interest rates have resulted in “extreme” losses in both bond and equity markets, both falling into the far-left tails of the historical return distributions.
Chart 6. The “extreme” performances of equities and bonds so far this year
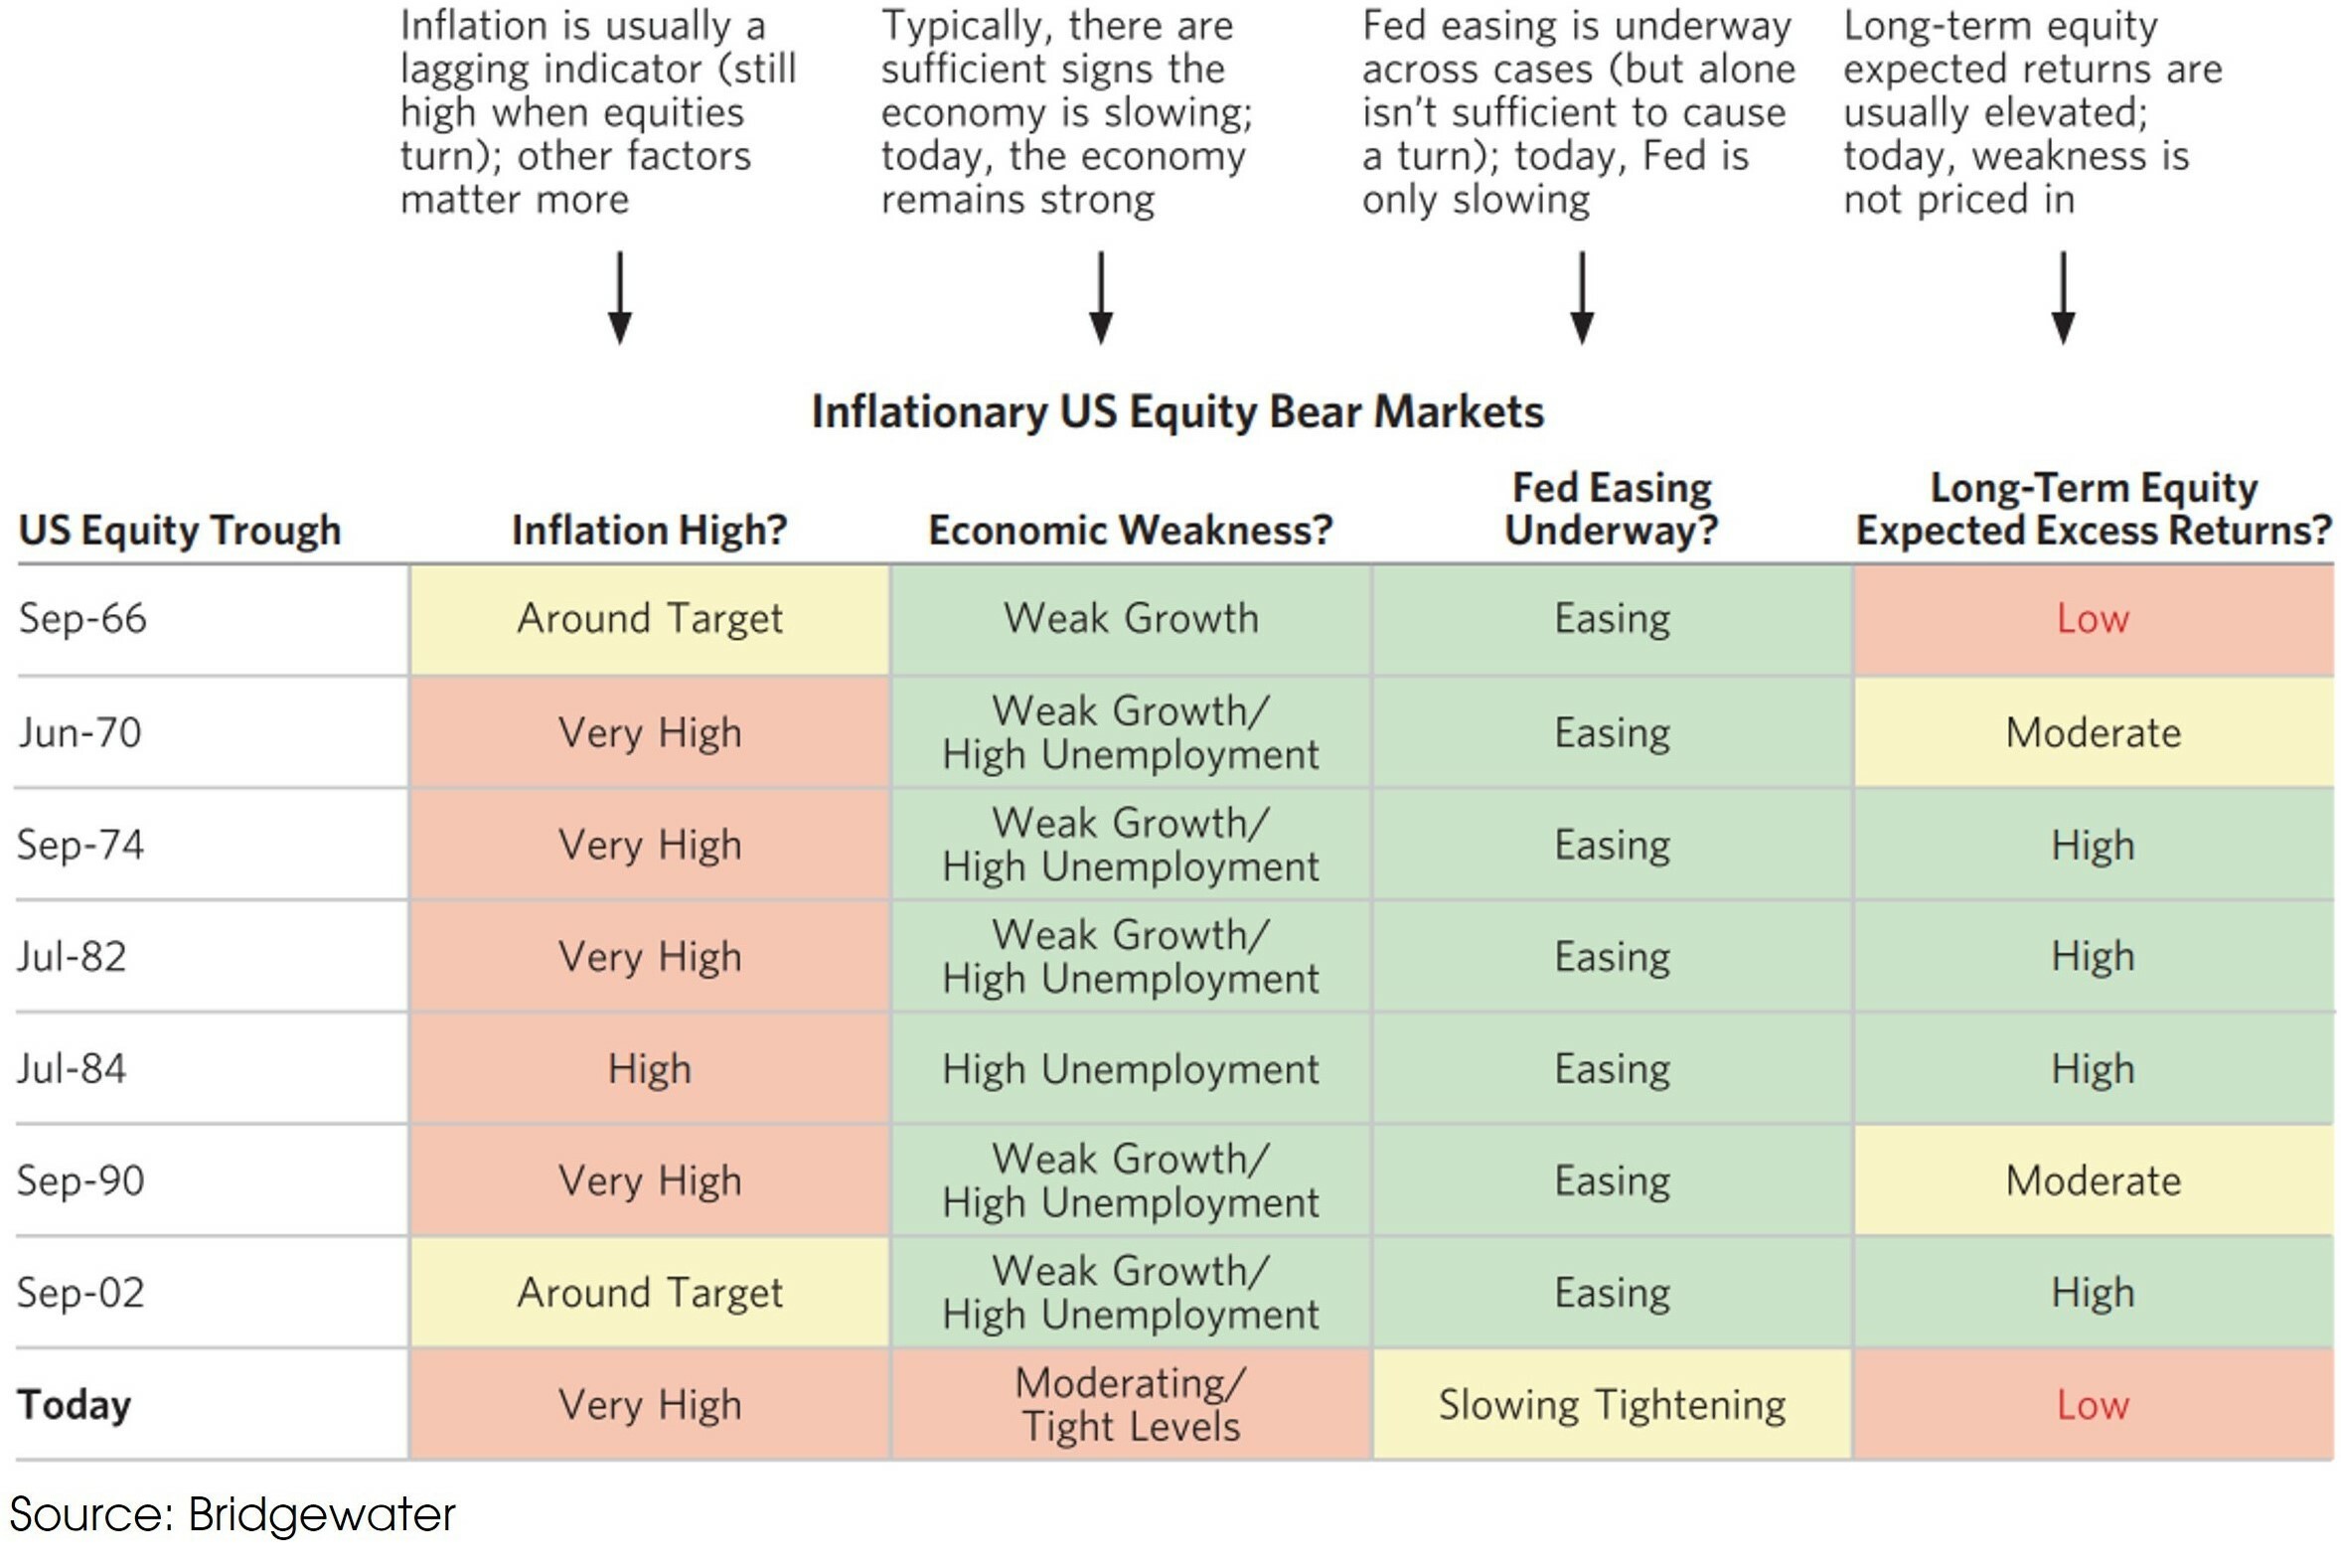
- Given the extreme YTD performances of bonds and equities, the currently moderating inflation pressure, and the peaking hawkishness from the Fed, investors cannot wait to see a turnaround in asset performances.
- However, historically, when inflation is “very high” (as the current condition), a trough in US equity market needs weak economic growth and easing monetary policy. Based on previous experiences, we are not there yet.
Chart 7. Historical troughs in the US equity market
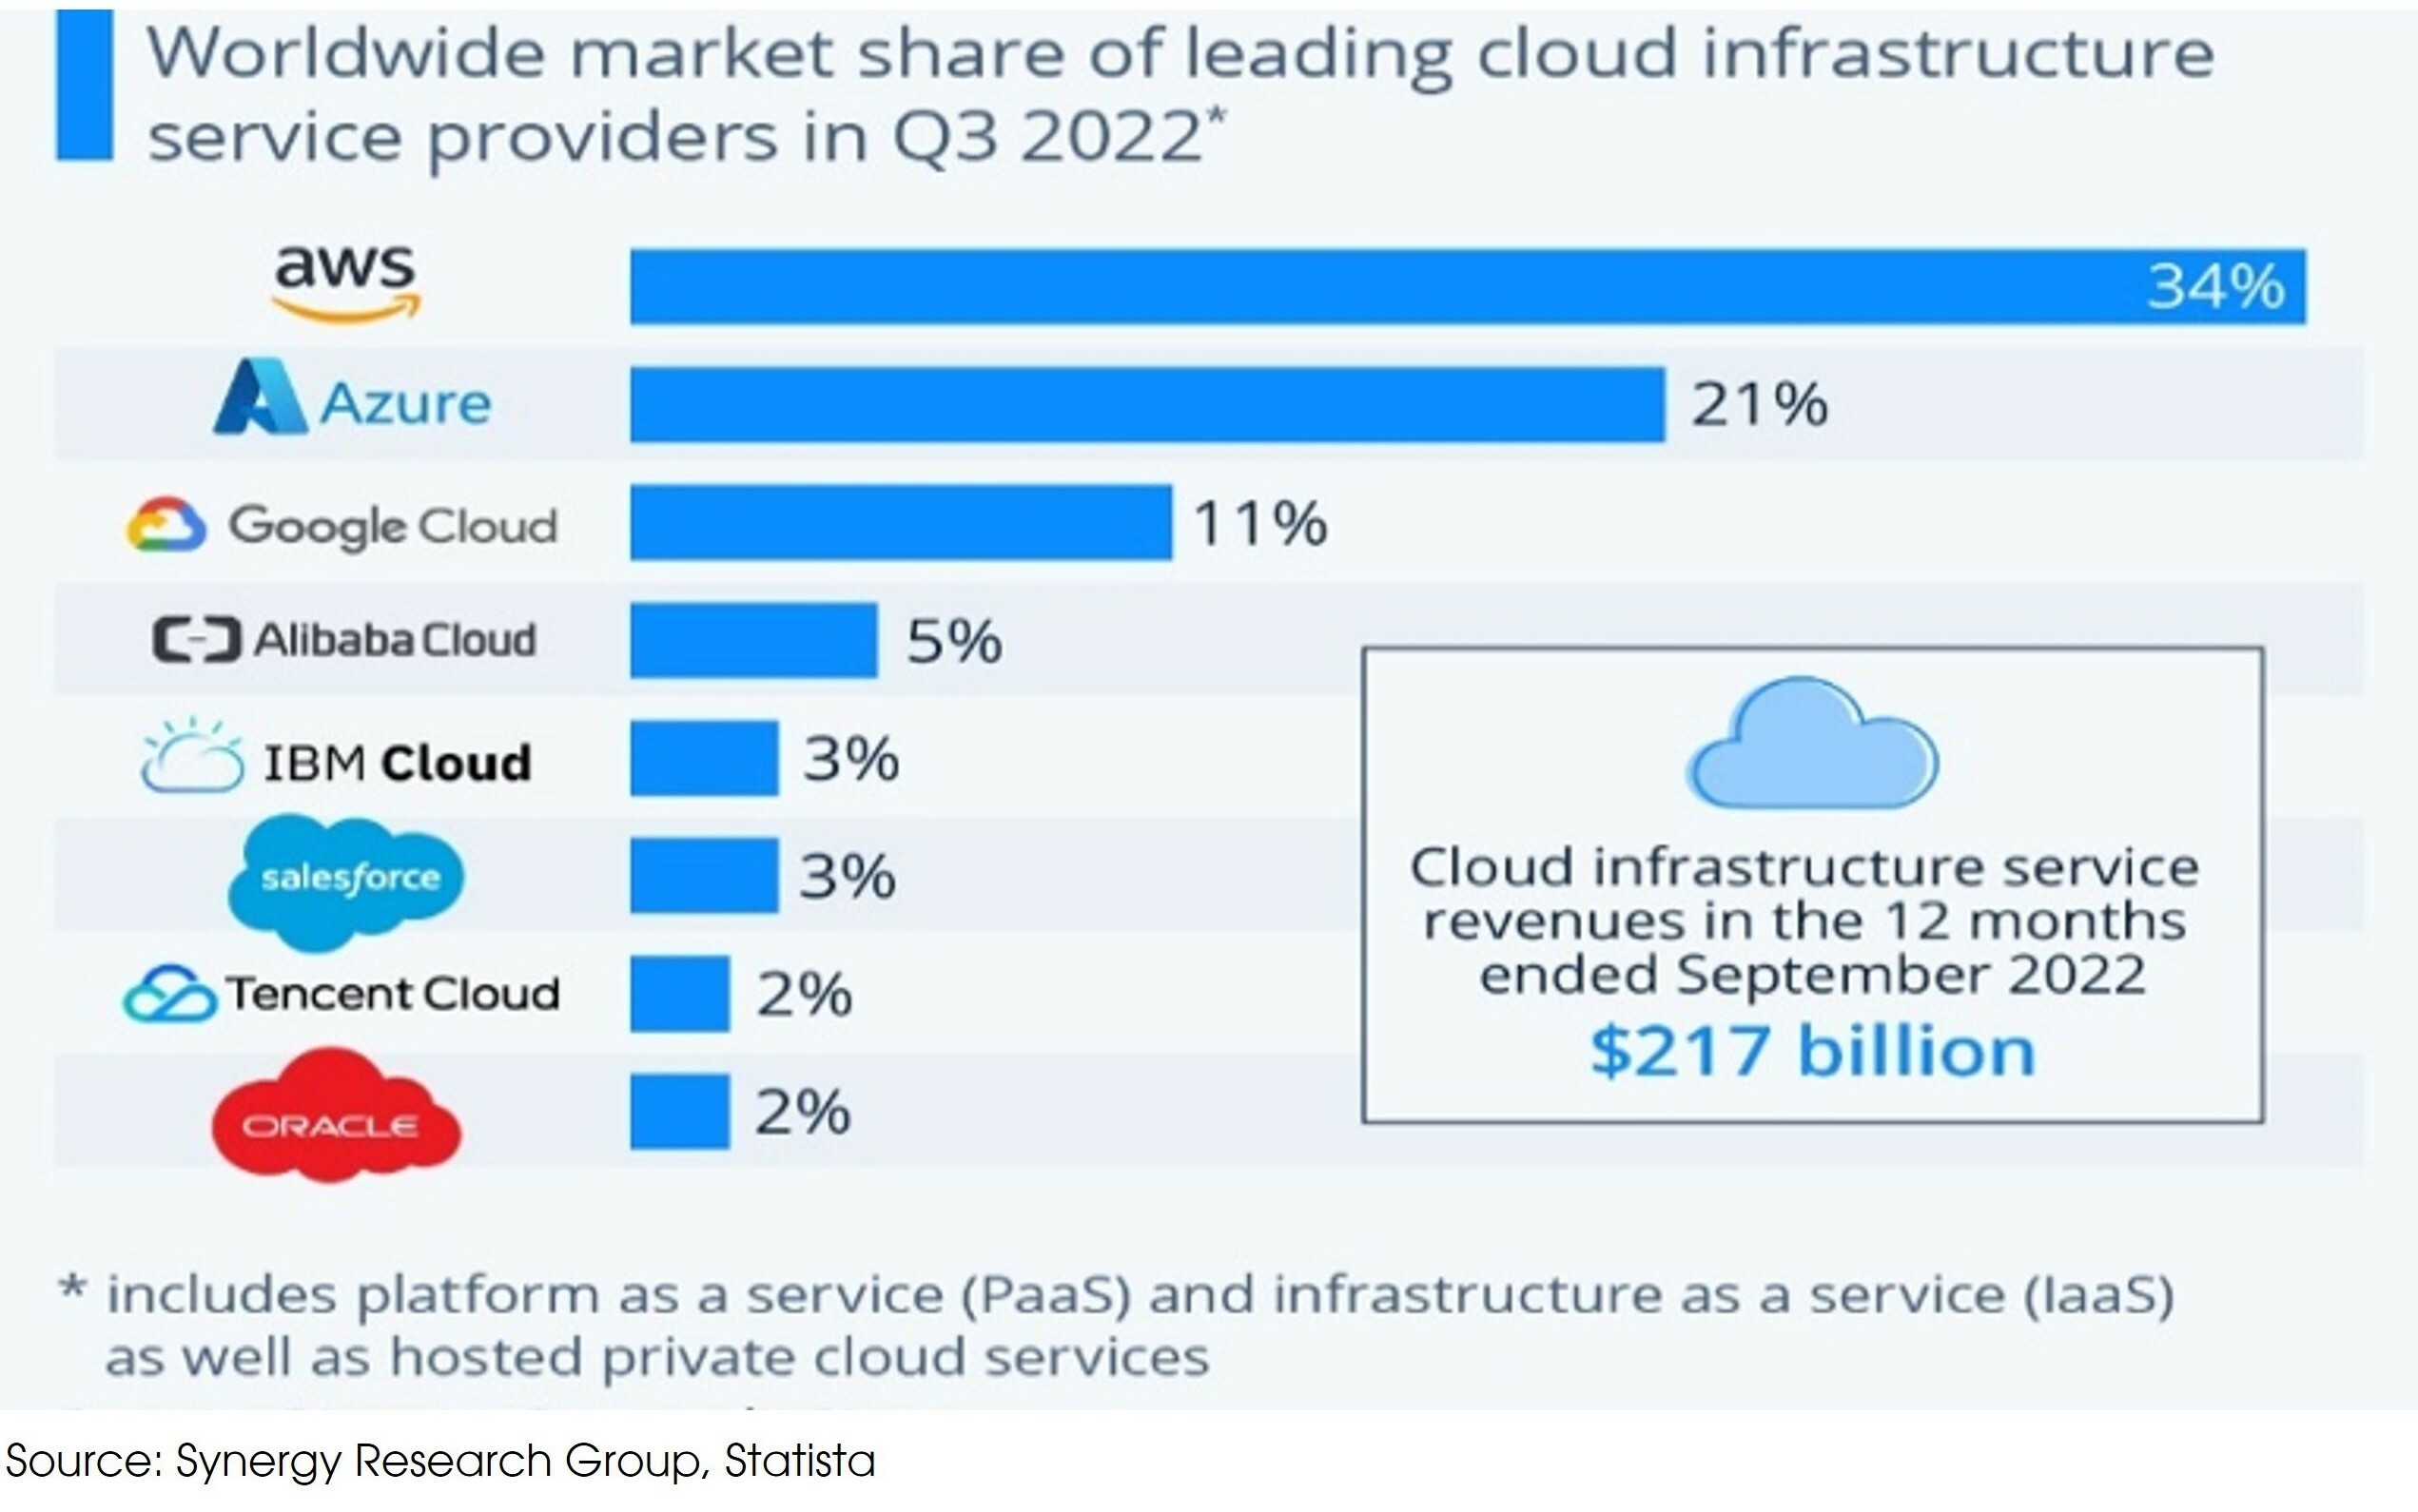
- The mega-cap Tech companies underperformed the overall S&P 500 this year. They may continue to face some headwinds going forward given the higher interest rates and their moderated sales growths. However, we still see these Tech giants to be well-positioned to benefit from the long-term Tech innovation trend.
Chart 8. Amazon, Microsoft and Google dominate Cloud Market

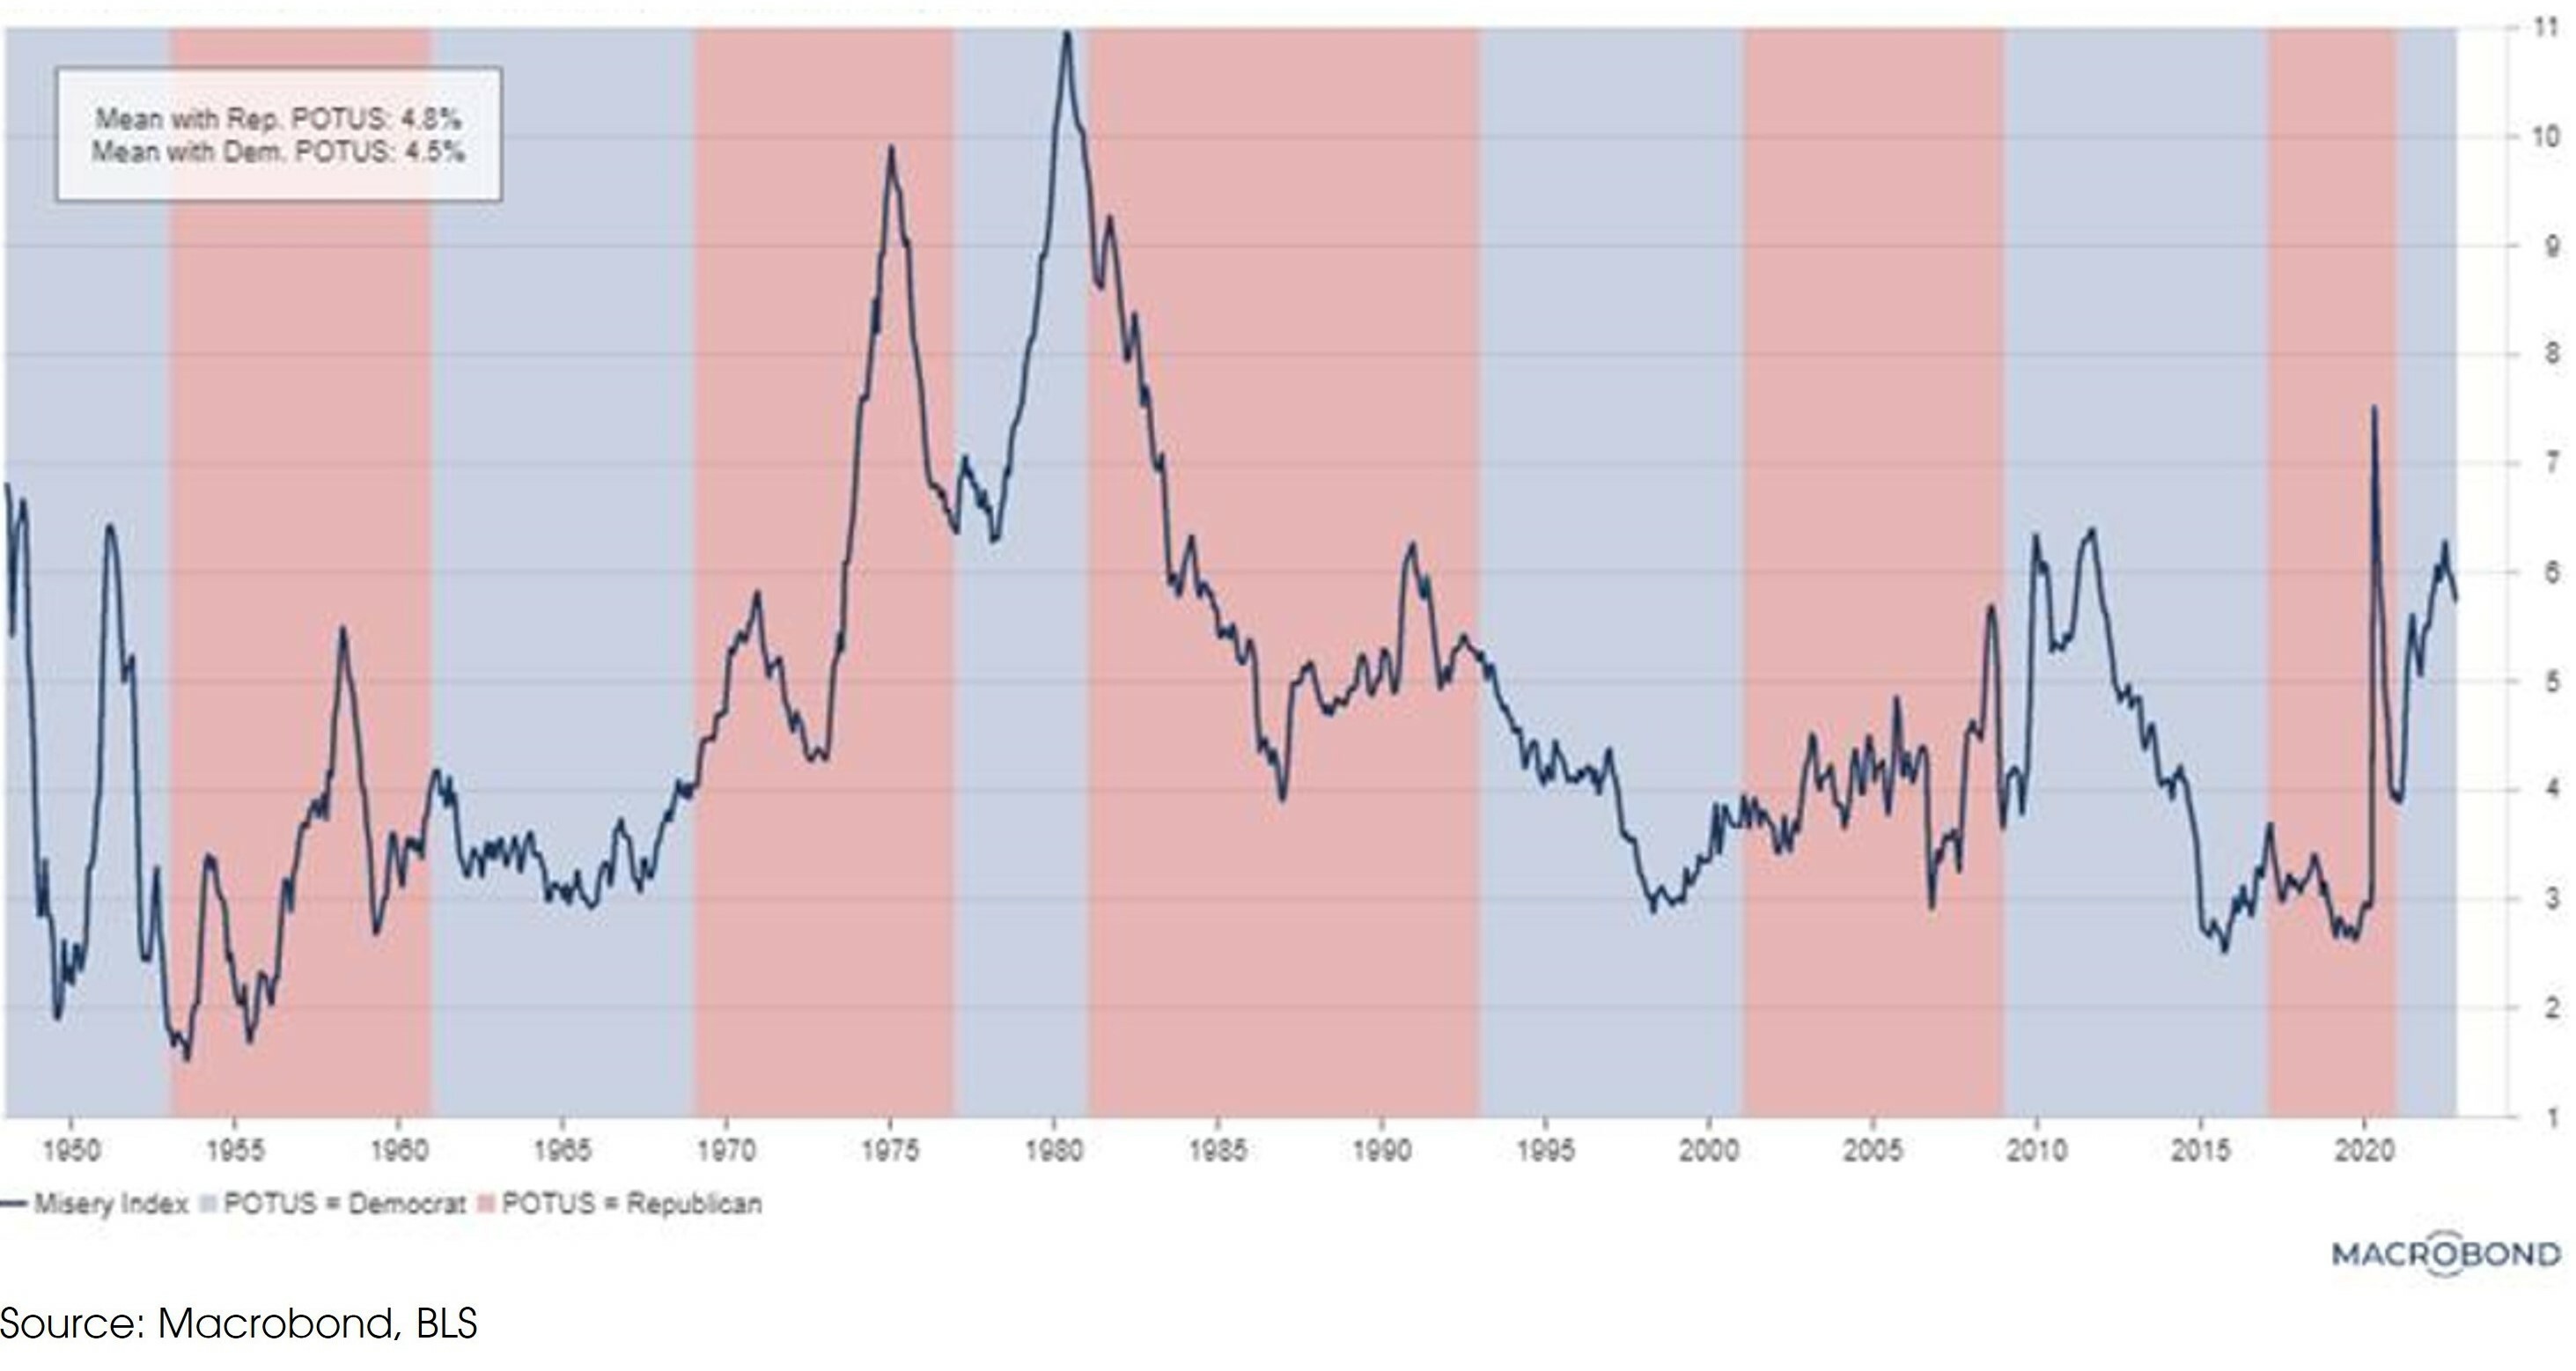
- Instead of “Red Waves”, the Republicans only had a tiny “Red Ripple”. Maybe the Misery Index can shed some light on this “unexpected result”? Historically, the US people feel a bit happier under Democrat governments.
Chart 9. US misery index and political party in power
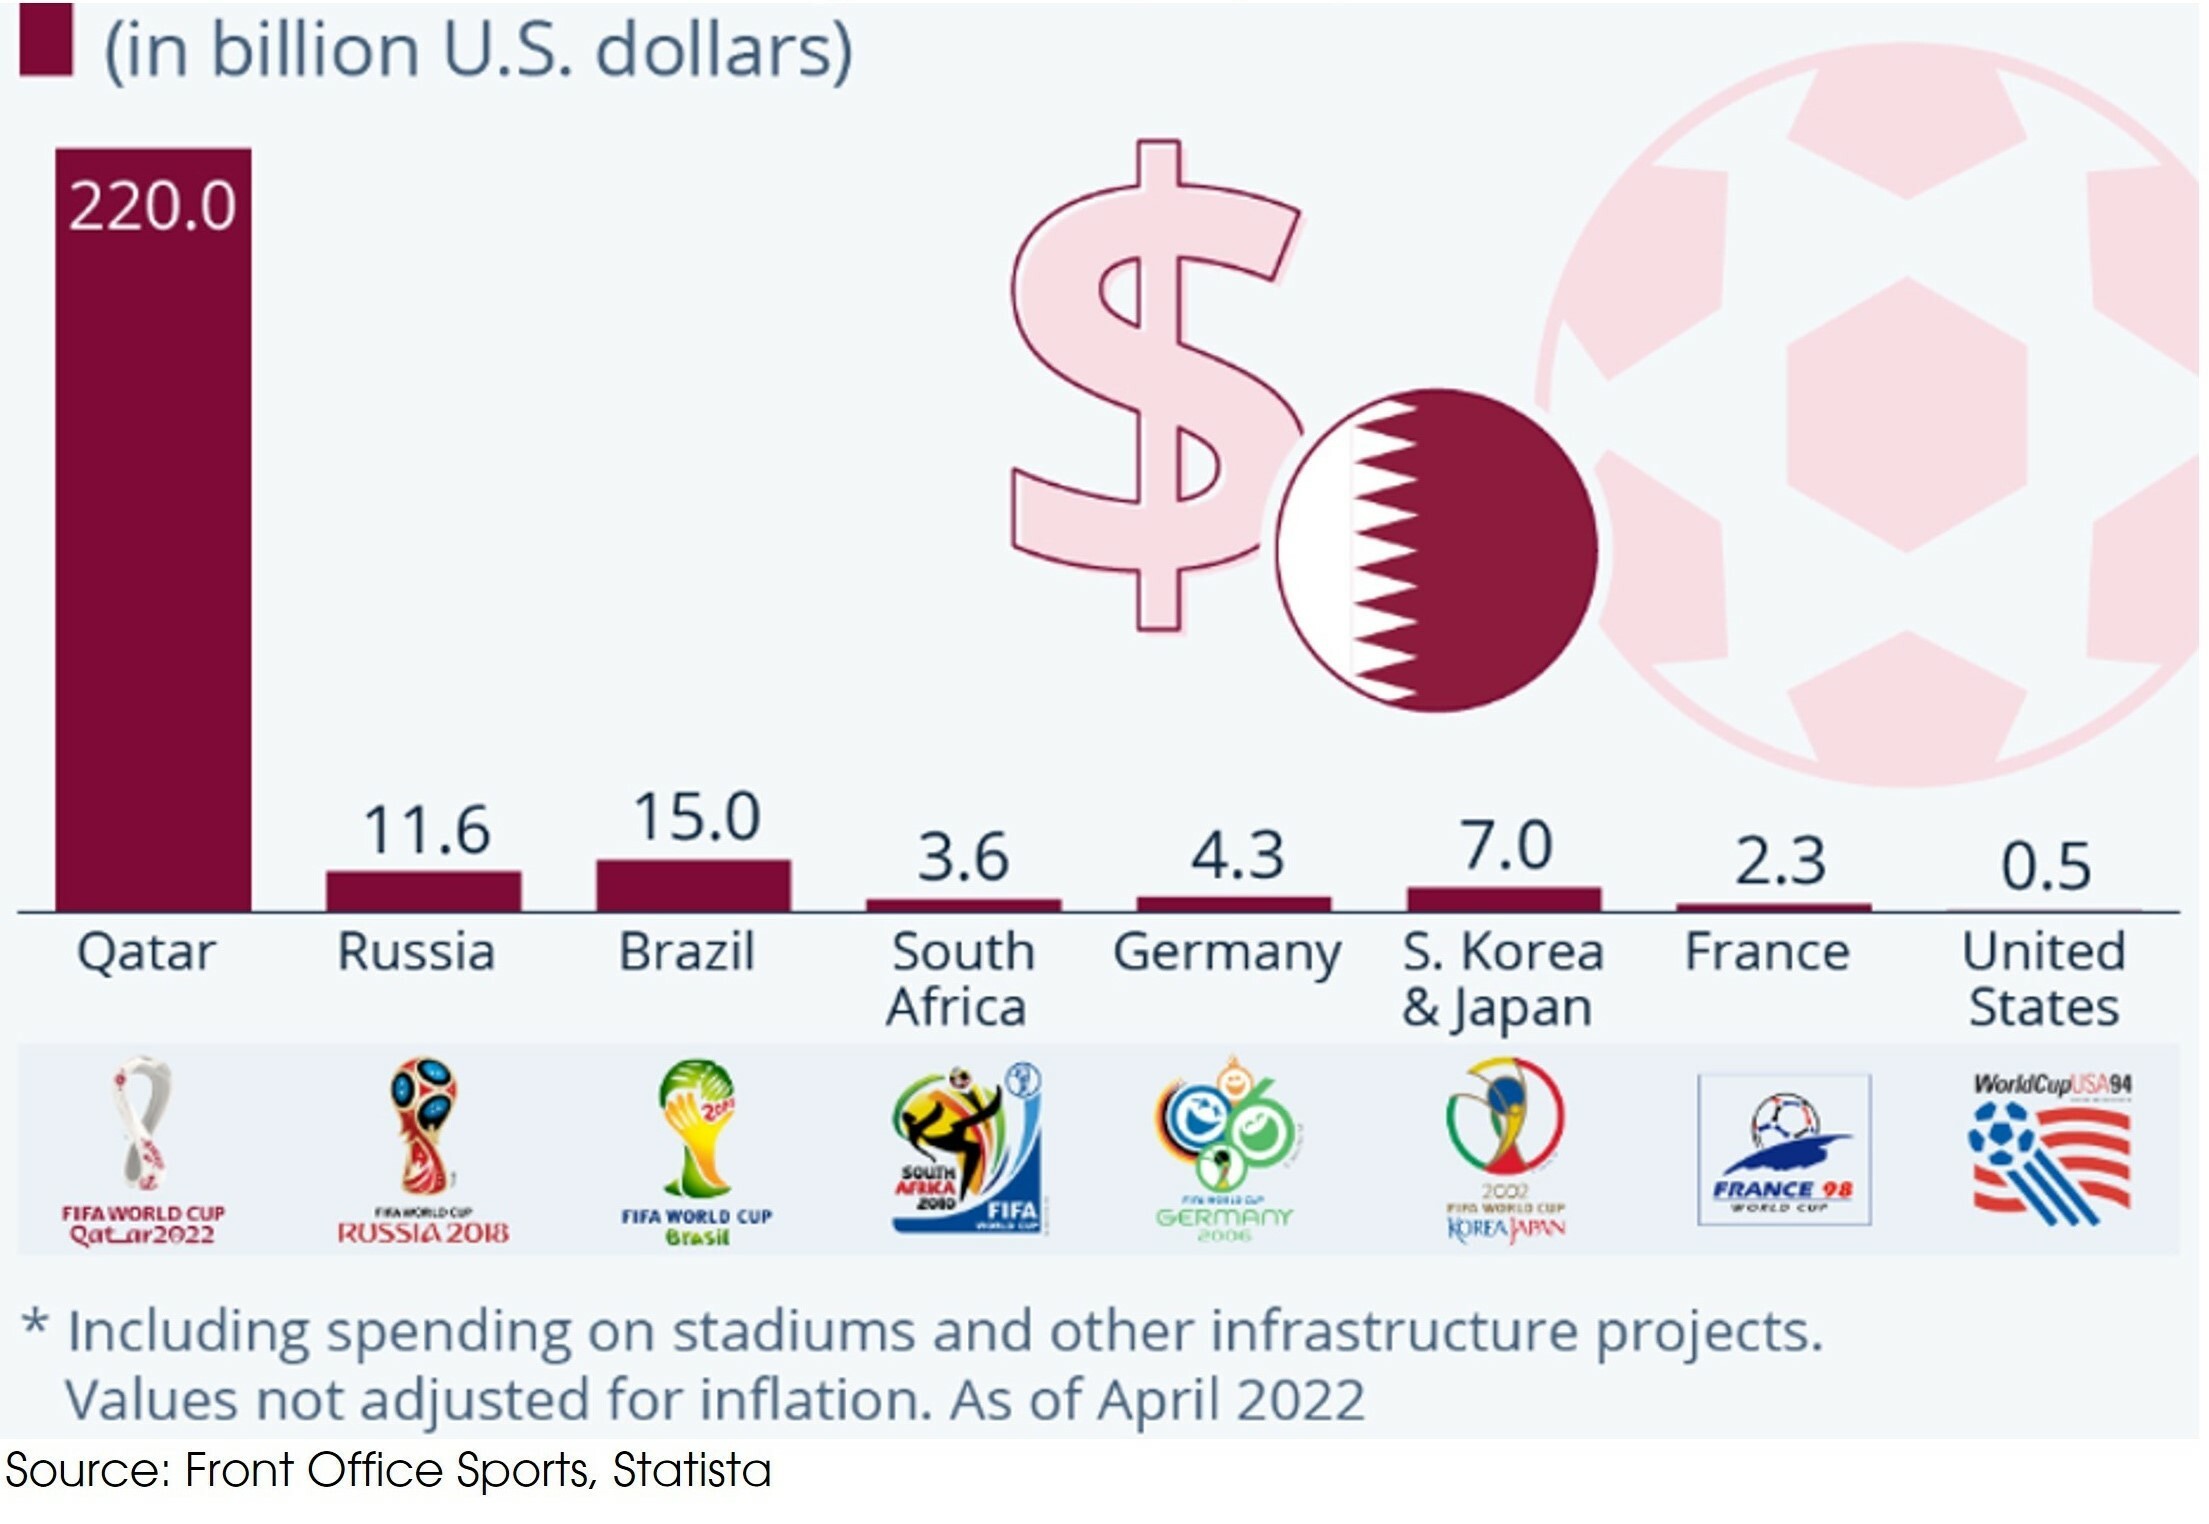
- Qatar is the first Middle East country to hold the World Cup, and it is holding the most expensive World Cup by far in history. Qatar is estimated to have spent USD 220 billion after being chosen as a World Cup host in late 2010, more than 15 times what Russia spent for the 2018 event. However, the actual cost can be higher, if you consider the recently reported labor abuse cases or the FIFA corruption investigations.
- Nevertheless, nothing can stop global football fans from enjoying the games.
Chart 10. Total costs of hosting World Cup by countries
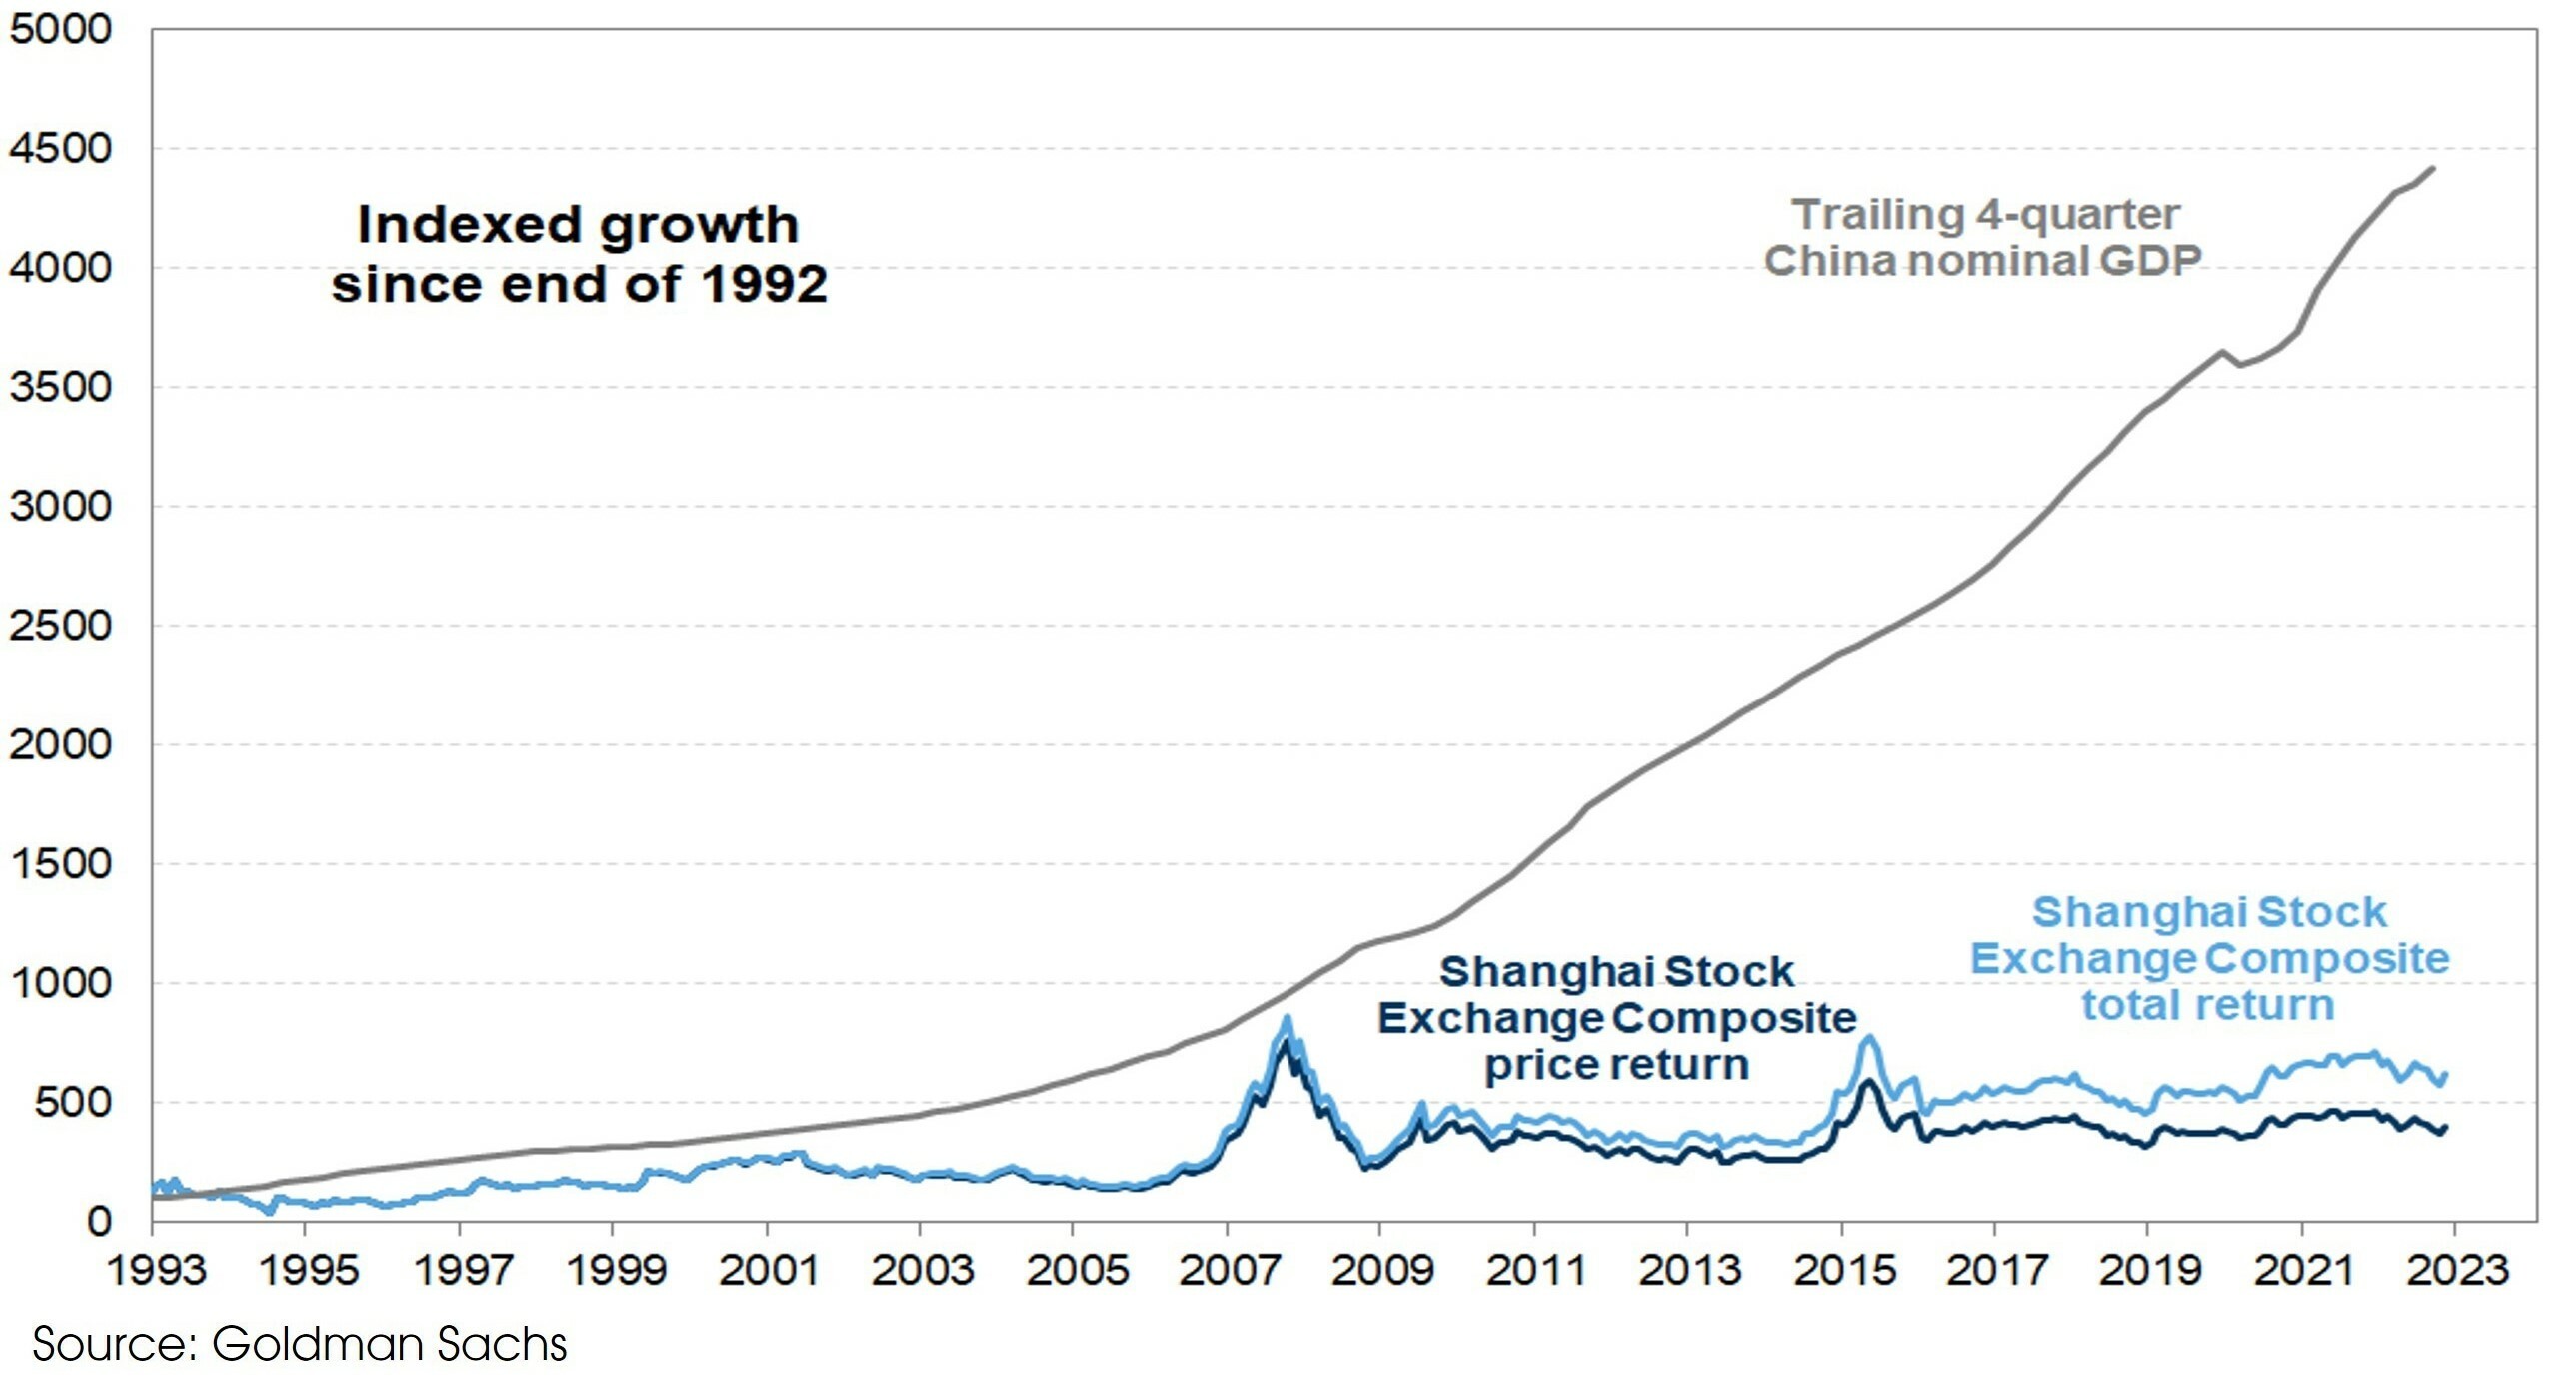
- Still think that high-growth emerging markets will offer higher long-term returns? Be careful. For some EM markets, it is hard to benefit from the high economic growth by investing in their stock markets.
- The Chinese GDP is up 44 times since 1992. By comparison, the US GDP is only up 4 times. Over the same period, the total return of A-shares is 6 times, while the S&P 500 is up 16 times.
- We are trying to find some emerging markets with smaller gaps between high economic growth and equity performance. India seems to be a potential candidate.
Chart 11. There is a huge gap between China’s stock market performance and GDP growth
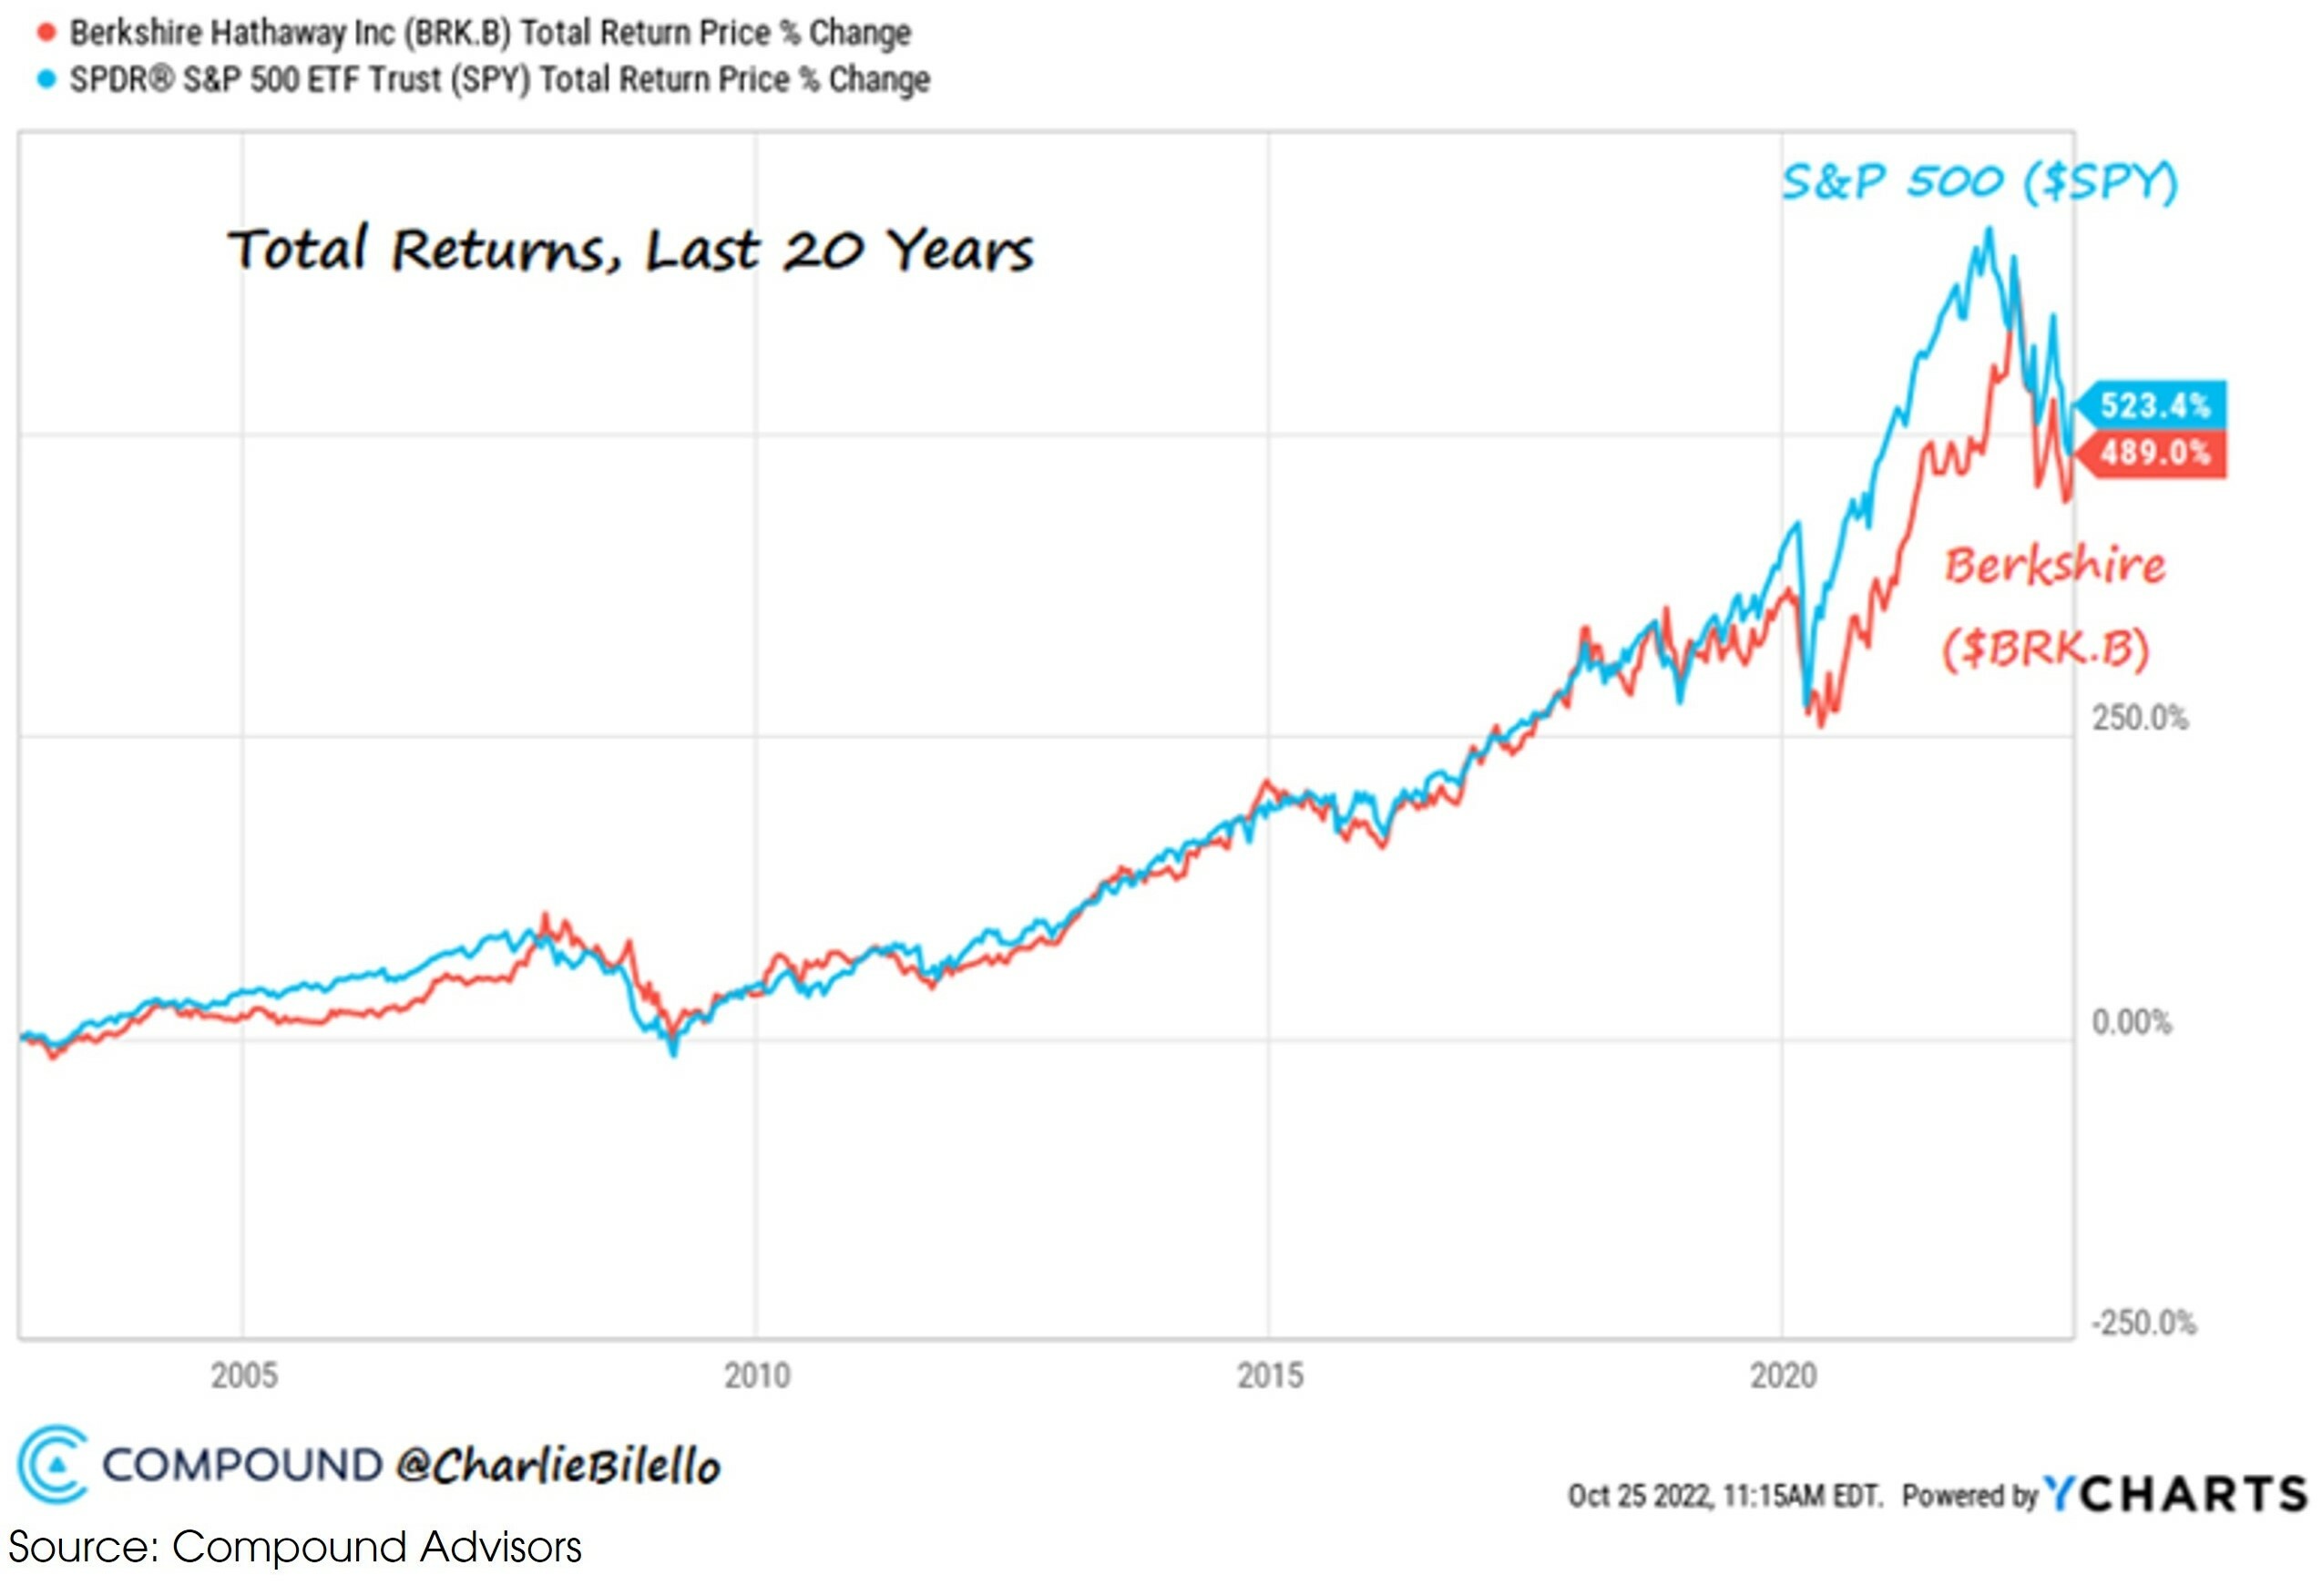
- Picking stocks and outperforming the market is hard, even for the best investors.
Chart 12. Total returns over the last 20 years: Berkshire Hathaway vs S&P 500
Disclaimer
This document is issued by Compagnie d’Investissements et de Gestion Privée Group (“CIGP”), solely for information purposes and for the recipient’s sole use and shall not be further transmitted to third parties. You have been provided with this document in your capacity as Professional Investor(s) as defined in Part 1 of Schedule 1 to the Securities and Futures Ordinance (Cap. 571). If you do not meet the Professional Investor criteria, please disregard this document.
CIGP does not assume responsibility for, nor make any representation or warranty (express or implied) with respect to the accuracy or the completeness of the information contained in or omissions from this document. None of CIGP and their affiliates or any of their directors, officers, employees, advisors, or representatives shall have any liability whatsoever (for negligence or misrepresentation or in tort or under contract or otherwise) for any loss howsoever arising from any use of information presented in this document or otherwise arising in connection with this document. This document may not be reproduced either in whole or in part, without the written permission of CIGP. Past performance is not a guarantee of future results. There can be no assurance that forecasts will be achieved. Economic or financial forecasts are inherently limited and should not be relied on as indicators of future investment performance.
This document is not a prospectus and the information contained herein should not be construed as an offer or an invitation to enter into any type of financial transaction, nor an act of distribution, a solicitation or an offer to sell or buy any investment product in any jurisdiction in which such distribution, offer or solicitation may not be lawfully made. Certain services and products are subject to legal restrictions and cannot be offered worldwide on an unrestricted basis and/or may not be eligible for sale to all investors. Unless cited to a third-party source, the information in this document is based on observations of CIGP. The information provided is based on numerous assumptions. Different assumptions could result in materially different results. Before acting on any information you should consider the appropriateness of the information having regard to your particular investment objectives, financial situation or needs, any relevant offer document and in particular, you should seek independent financial advice. All securities and financial product or instrument transactions involve risks, which include (among others) the risk of adverse or unanticipated market, financial or political developments and, in international transactions, currency risk. The contents of this report have not been and will not be approved by any securities or investment authority in Hong Kong or elsewhere.
CIGP acts as an agent when recommending or distributing investment products. The product issuer is not an affiliate of CIGP. CIGP is an independent intermediary, because: (i) we do not receive fees, commissions, or any other monetary benefits, provided by any party in relation to our distribution of any investment product to you; and (ii) we do not have any close links or other legal or economic relationships with product issuers, or receive any non-monetary benefits from any party, which are likely to impair our independence to favour any particular investment product, any class of investment products or any product issuer. Neither us nor our group related companies shall benefit from product origination or distribution from the issuers or providers, whether in monetary or non-monetary terms. We do not provide any discount of fees and charges.
Sources: Alpine Macro, Bloomberg, BLS, Bridgewater, Compound Advisors, Federal Reserve, FedWatch, Front Office Sports, Goldman Sachs, Lombard Odier, Macrobond, Media Reports, Statista, Synergy Research Group, Zillow Resaerch, CIGP Estimates


