
CIO Viewpoint: Deglobalization - not yet a trend, but a rising risk

Over the past decade, the Brexit referendum, Trump’s protectionism policies, the US-China trade war, and the pandemic-related supply chain disruptions have all reflected the increased vulnerability of global trade.
Russia’s invasion of Ukraine further endangered the rules-based international order. The massive sanctions imposed on trade and the financial system exacerbated the concerns of the unfolding deglobalization trend.
This report looks at the long-term global trade patterns and the potential future changes due to the rising vulnerability.
The decrease of trade to GDP ratio
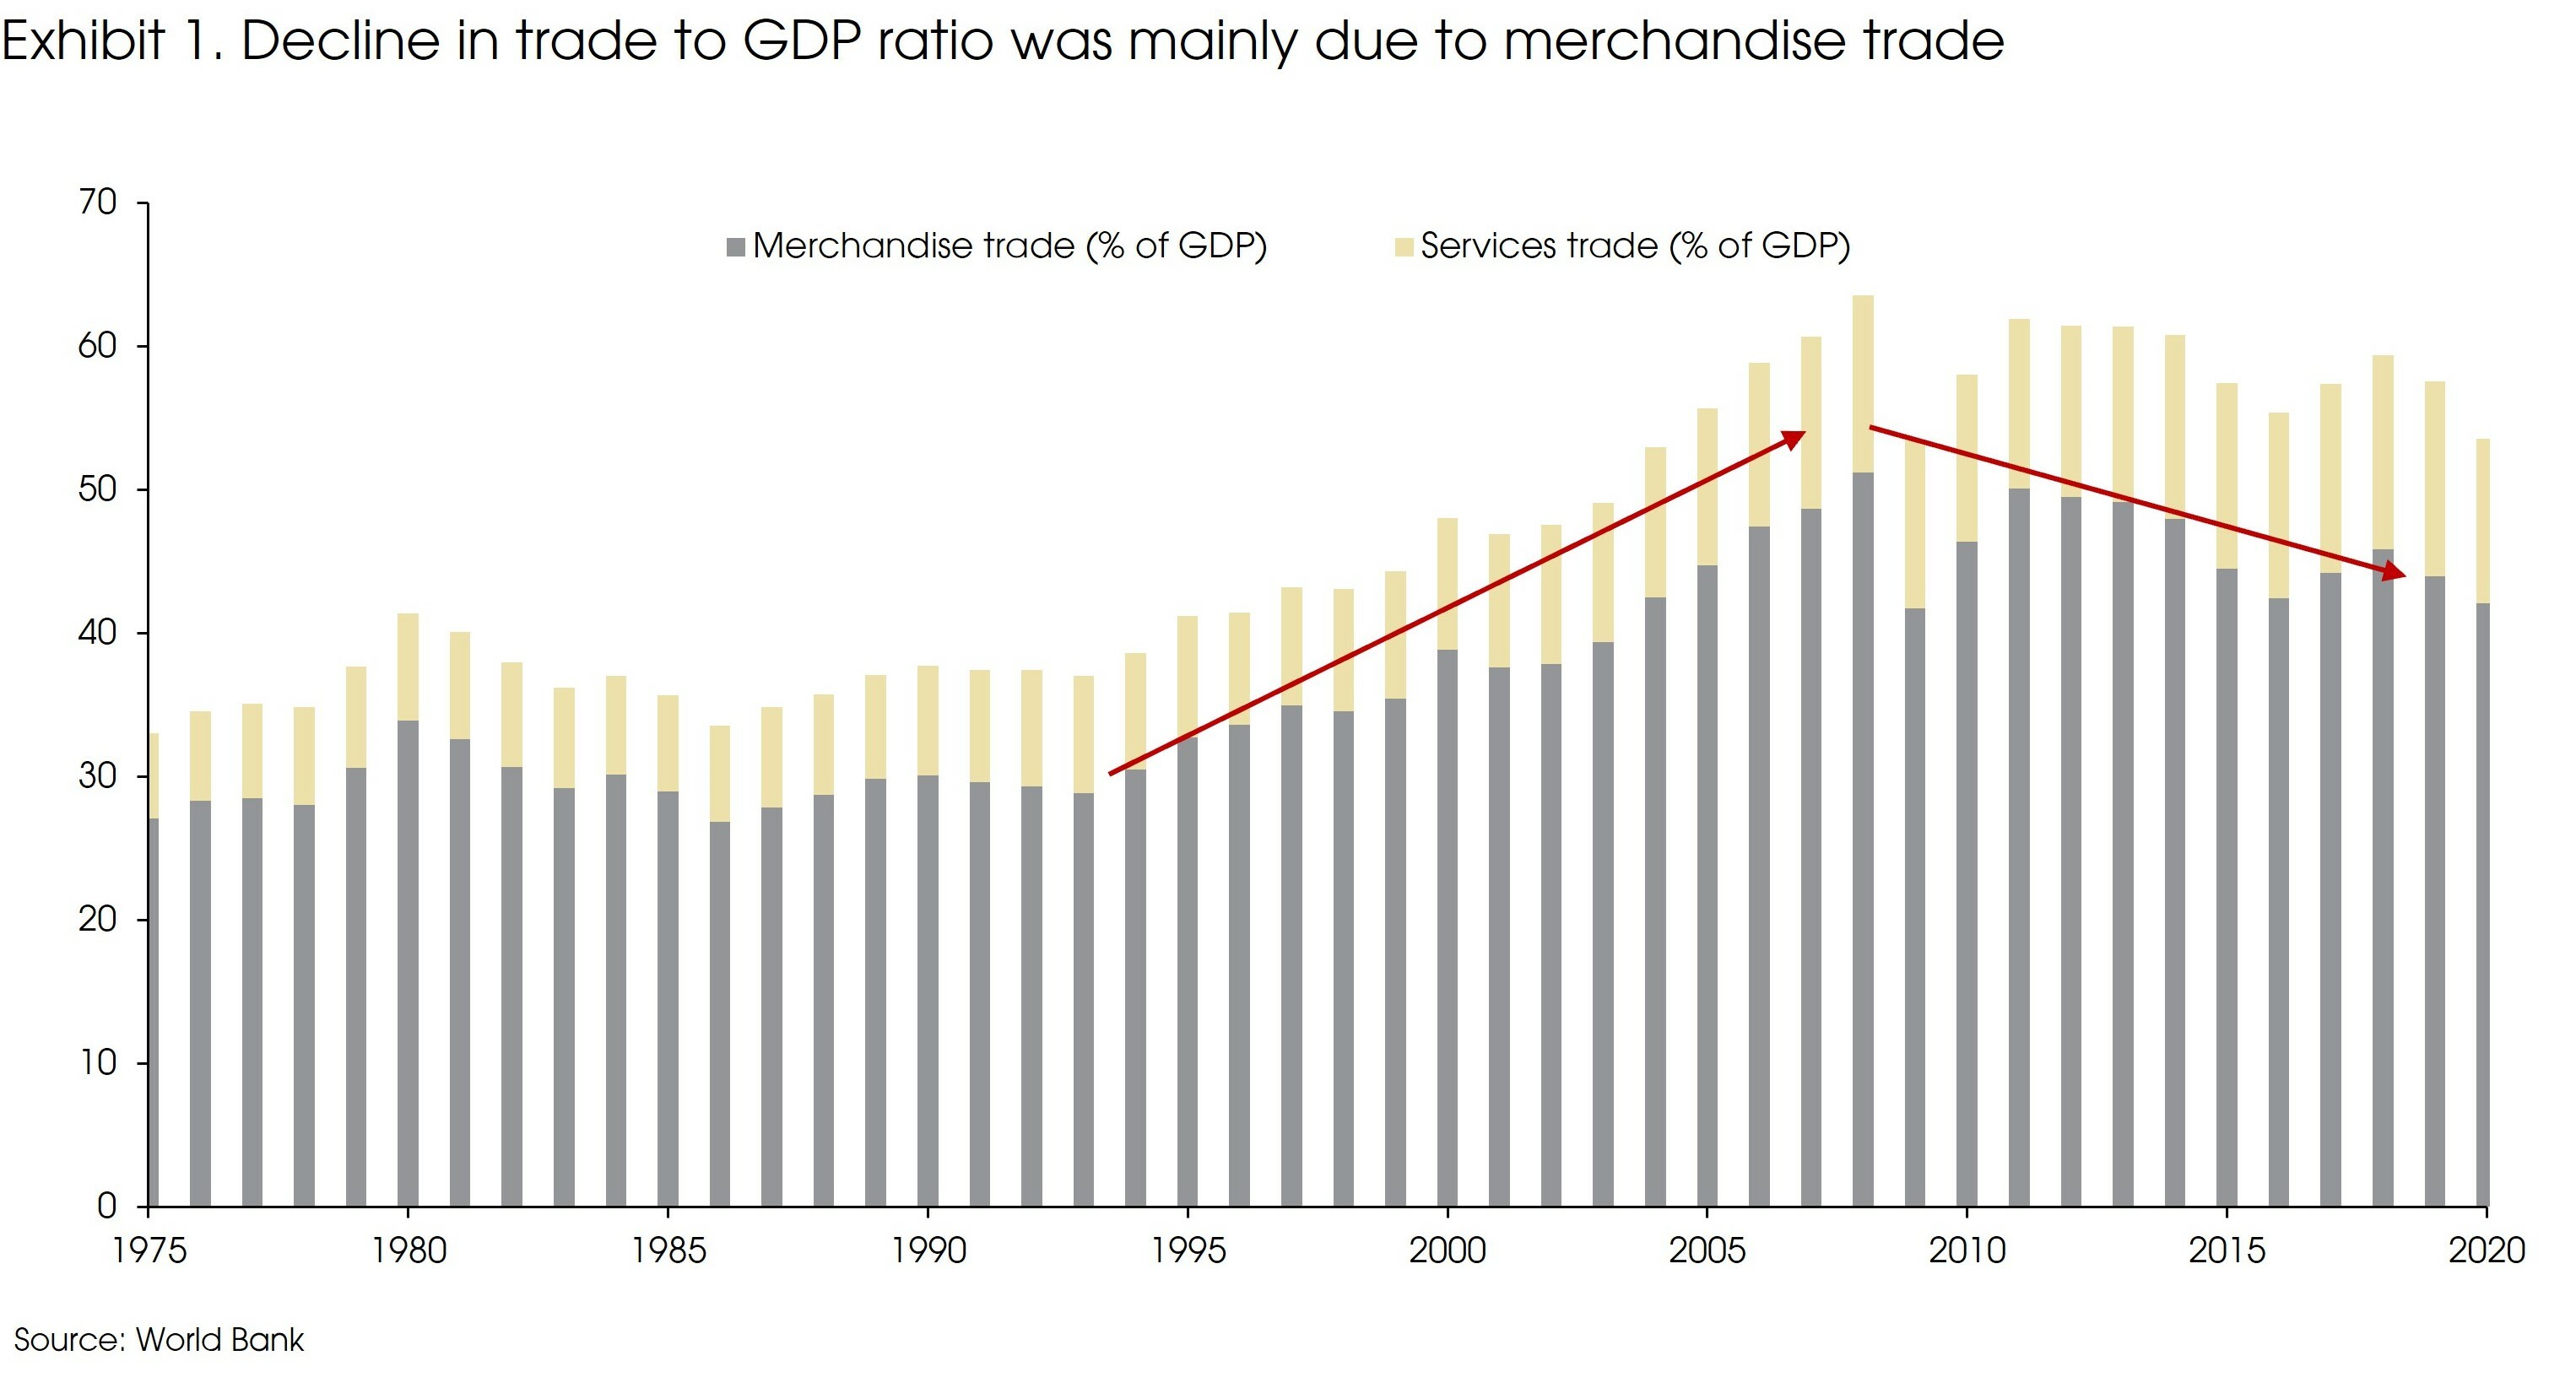
The most used indicator for globalization is the trade to GDP ratio (or trade openness index). The ratio has declined from 63% in 2008 to 57% in 2019.
Such an overall trend could reflect the rising protectionism among major economies and a reversal of globalization after the 2008 financial crisis.
However, a more granular view suggests, at least, there are other factors explaining the decline.
(Exhibit 1) The recently declining trade to GDP ratio was mainly driven by merchandise trade. Services trade to GDP ratio kept increasing until the pandemic.
More specifically, the declining merchandise trade to GDP ratio was mainly driven by the trade of fuels and mining products, and manufacturing products. Agricultural trade maintained a stable growth versus GDP (Exhibit 2).
One reason for the declined trade growth in fuels and mining products was the significant price falls from 2010 to 2019, especially for fuels. In the meantime, agricultural prices also fell, but to a lesser extent.
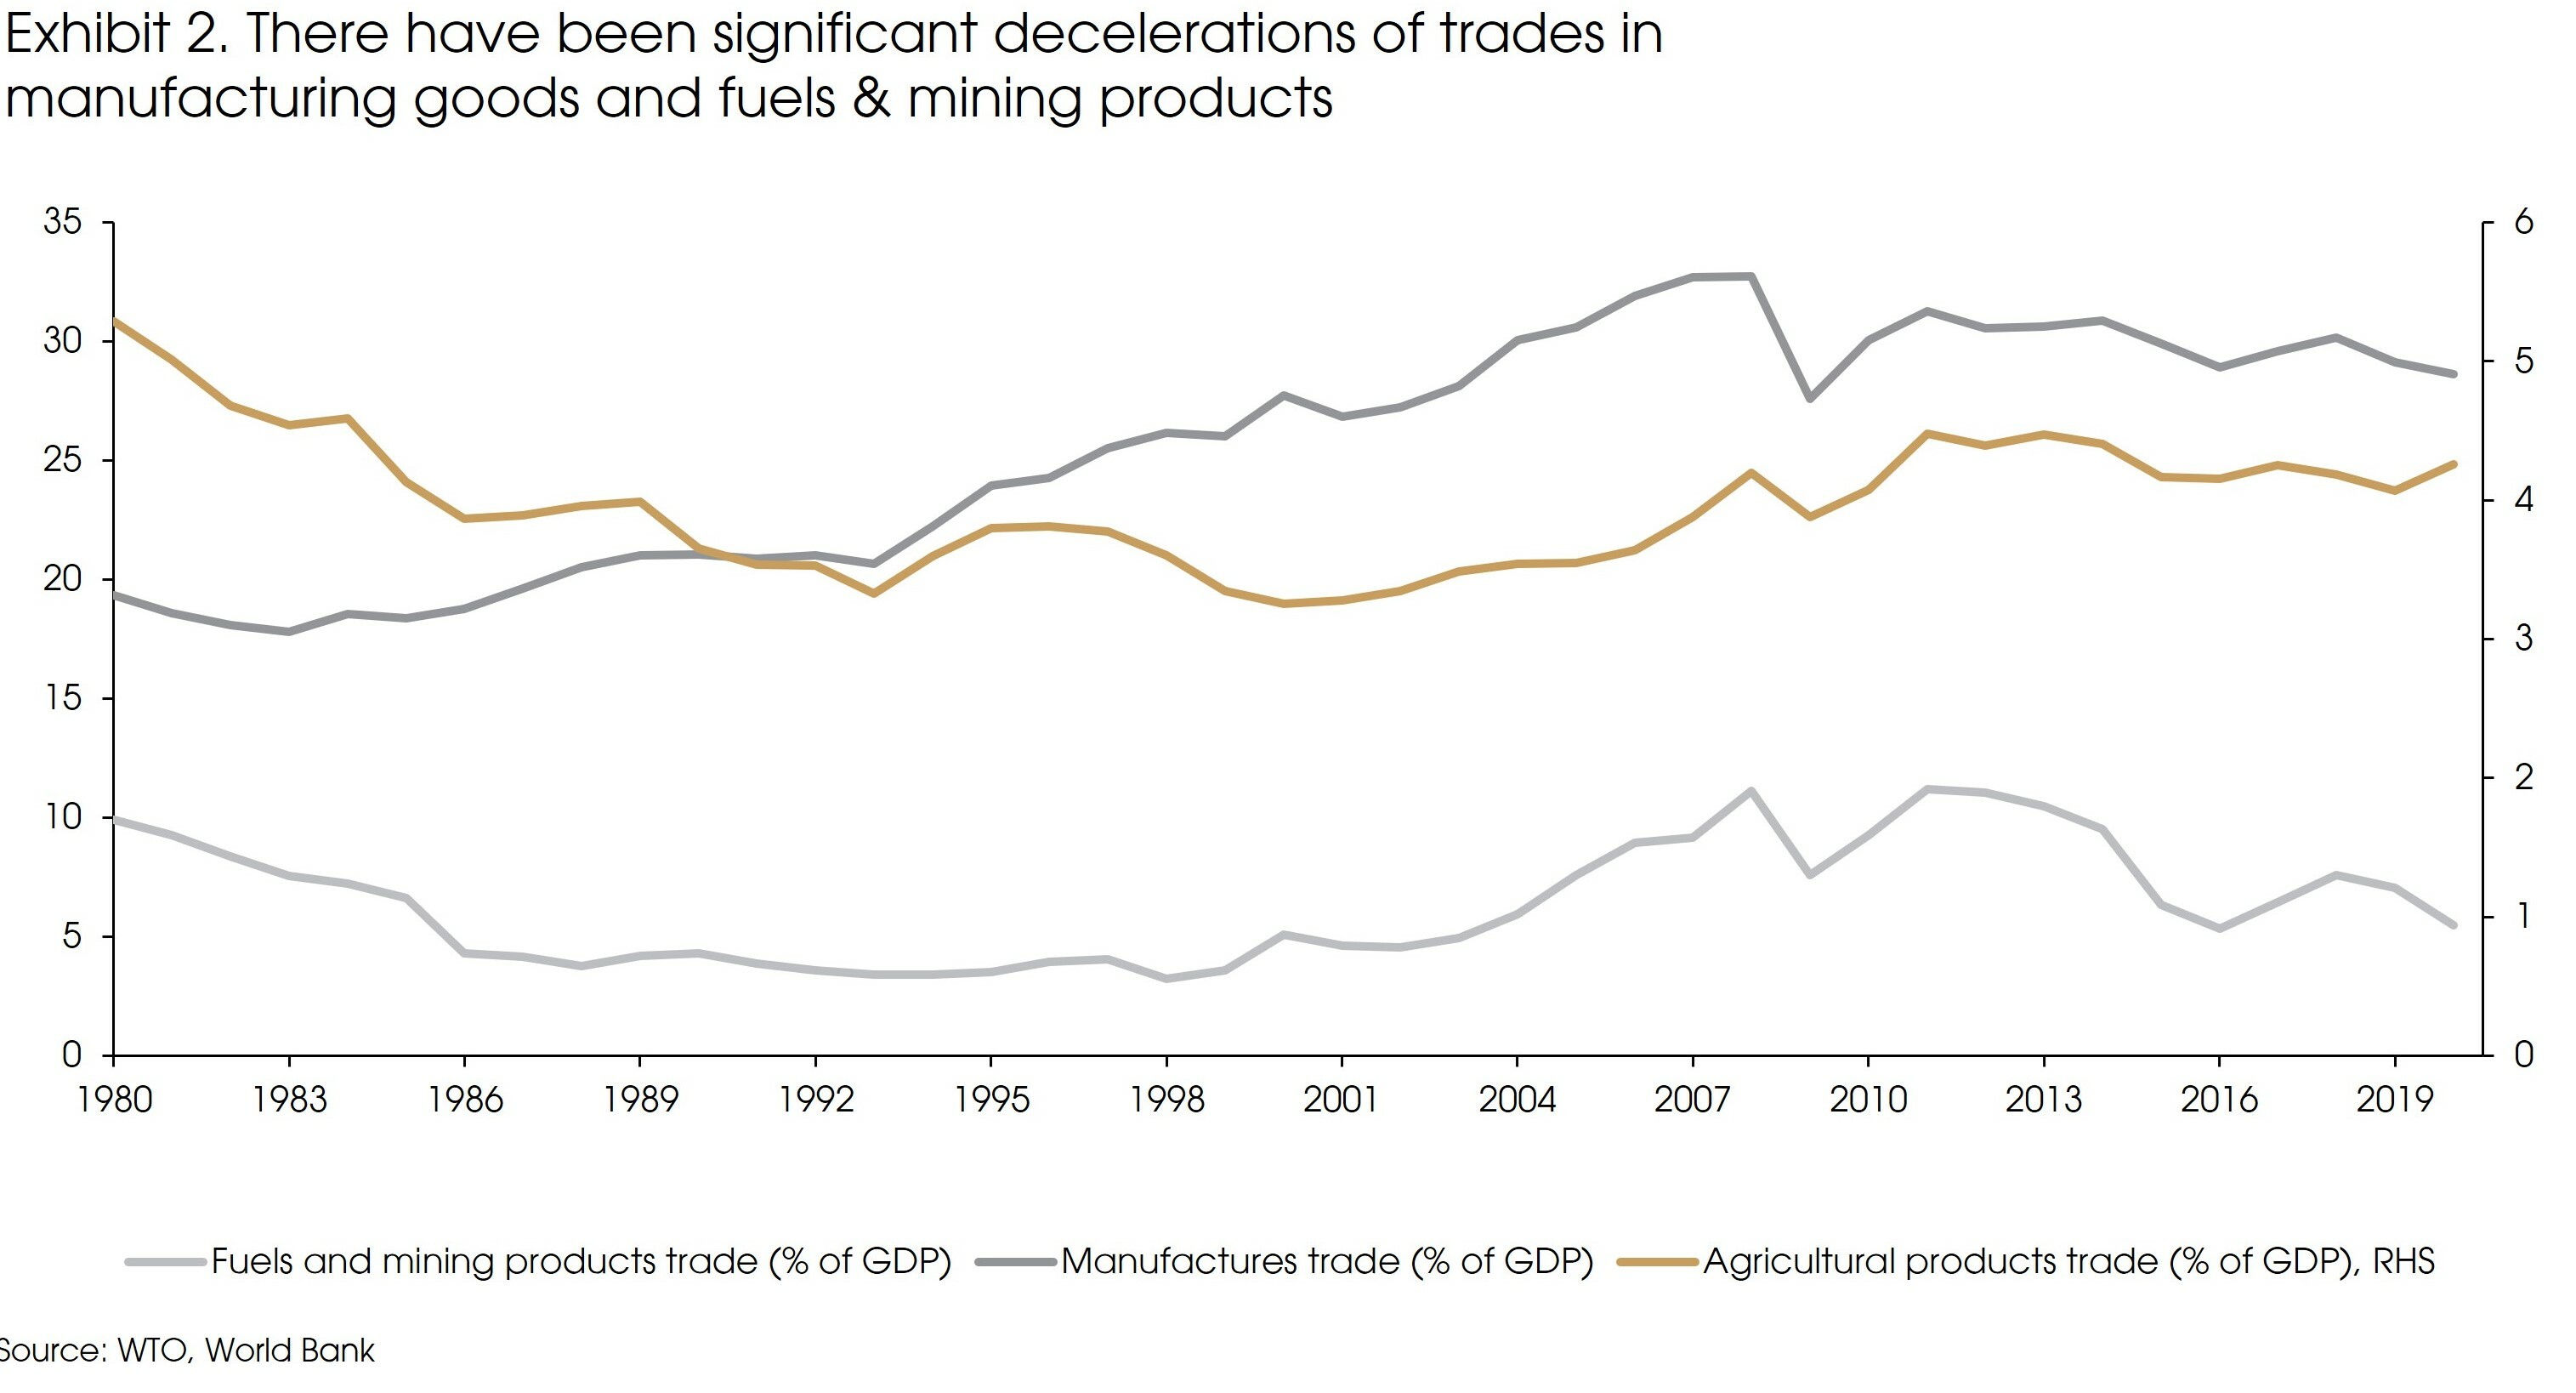
For manufacturing trade, China contributed a significant part of the decline. The share of manufacturing trade to GDP was significantly lifted by the establishment of the WTO in 1994 and China’s entrance in 2002. However, there is a lack of positive catalysts to further boost the trade growth after these.
In addition, the advance in manufacturing technology during the past decade has enabled localization and vertical integration of supply chains within many emerging market economies.
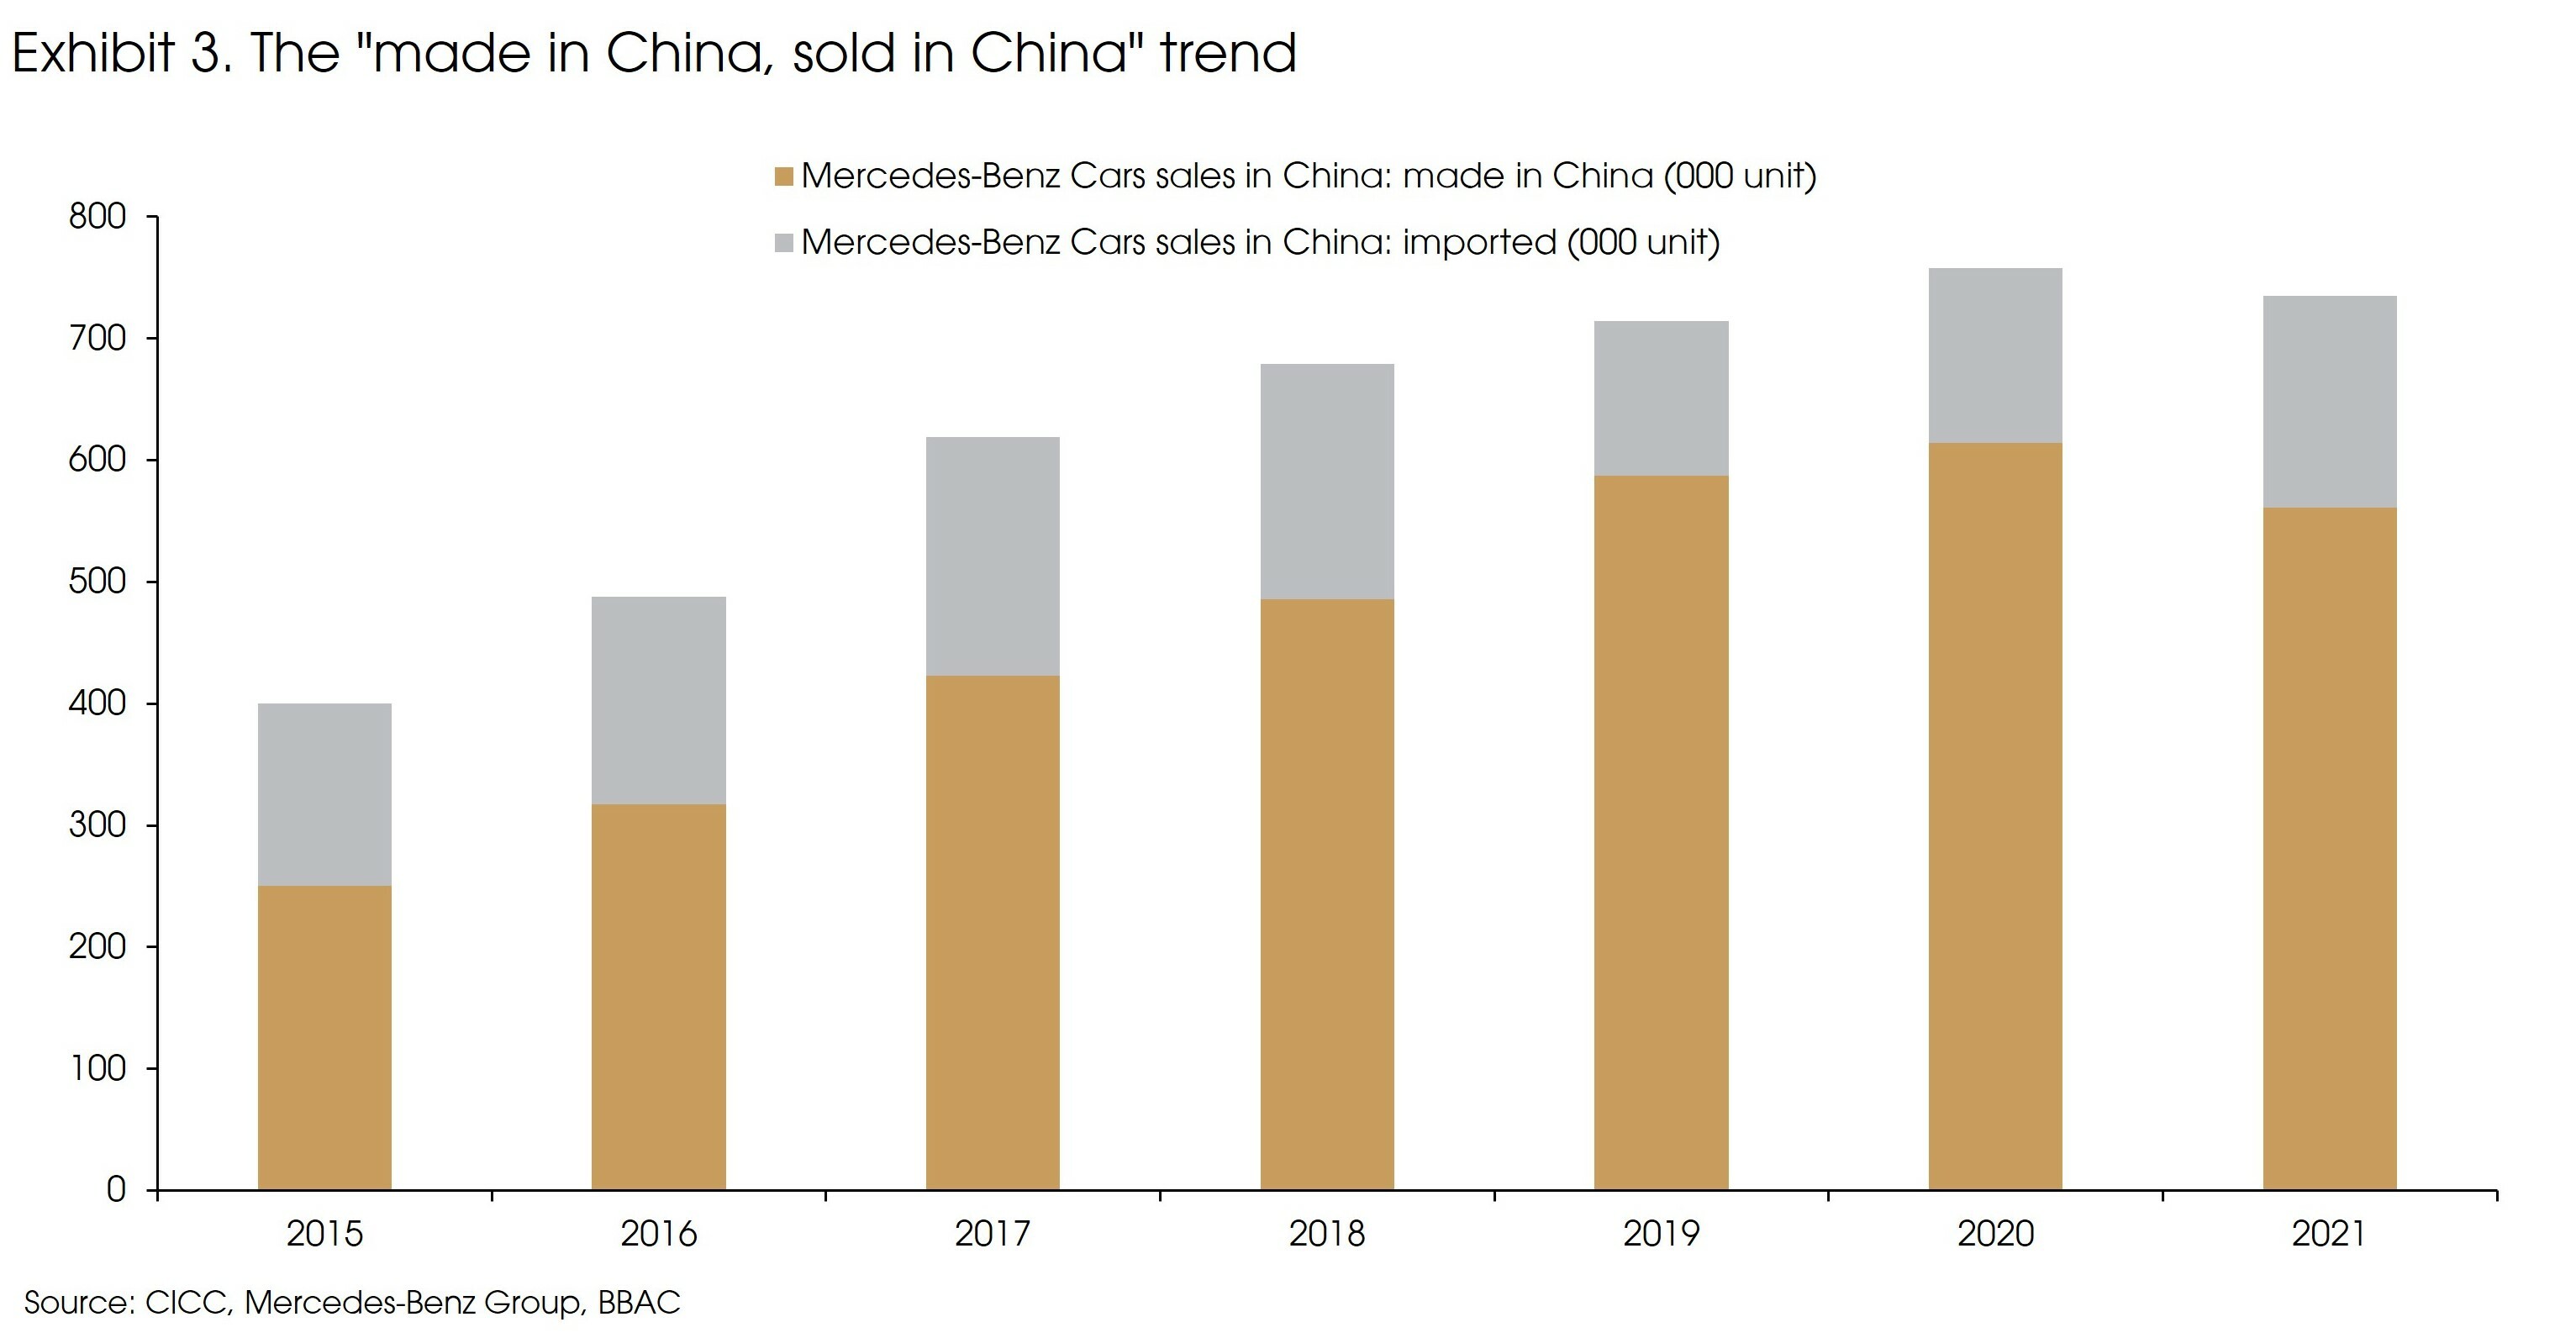
More importantly, China’s consumer market increased from USD 1.6 billion in 2008 to USD 6.0 billion in 2019, challenging that of the US (USD 6.2 billion in 2020, v.s., USD 4.4 billion in 2008). The rapidly growing consumer market has shifted the “made in China, sold abroad” model into “made in China, sold in China” in many sectors.
Currently, around 70% of China’s total industrial production supplies domestic demand. Exhibit 3 shows the sales of the Mercedes-Benz cars in China: The domestic production share increased from 60% in 2015 to 80% in 2019.
The growing domestic market has further facilitated localization of supply chains and productions, leading to reduced cross-border flows of manufactured goods.
Protectionism and trade tensions have affected trade. However, it has not been significant enough to reverse the globalization trend. Both the UK and the Eurozone’s trade to GDP ratio kept rising despite the Brexit referendum in 2016. China’s trade growth also significantly picked up after the pandemic outbreak in 2020.
Besides, in some sectors, globalization has developed further. For example, services were once hard to export, but the rapidly growing digital economy has facilitated the exploding cross-border data traffic and services, such as software, video games, and music.
Finally, despite all the trade frictions, multi-national companies’ overseas income has remained stable. According to FactSet, the share of overseas income for companies within the MSCI-Japan Index increased from 45% in 2008 to 57% in 2019. In the meantime, this number remained at 40% for the S&P 500 Index and the MSCI-Europe Index.
Rather than deglobalization, the overall trend during the past decade was more like a “slowbalization”, or a “globalization 2.0”.
The changing trade map to respond to new vulnerabilities
Trade patterns have relatively remained stable over the medium to long run, reflecting comparative advantages among different economies. For example, the US-Japan trade war in 1980s did not turn the US into a manufacturing exporter or affect Japan’s status as a major global manufacturing center. The supply chain relocation away from China and the US-China trade war also did not affect China as a top manufacturing exporter (Exhibit 4).
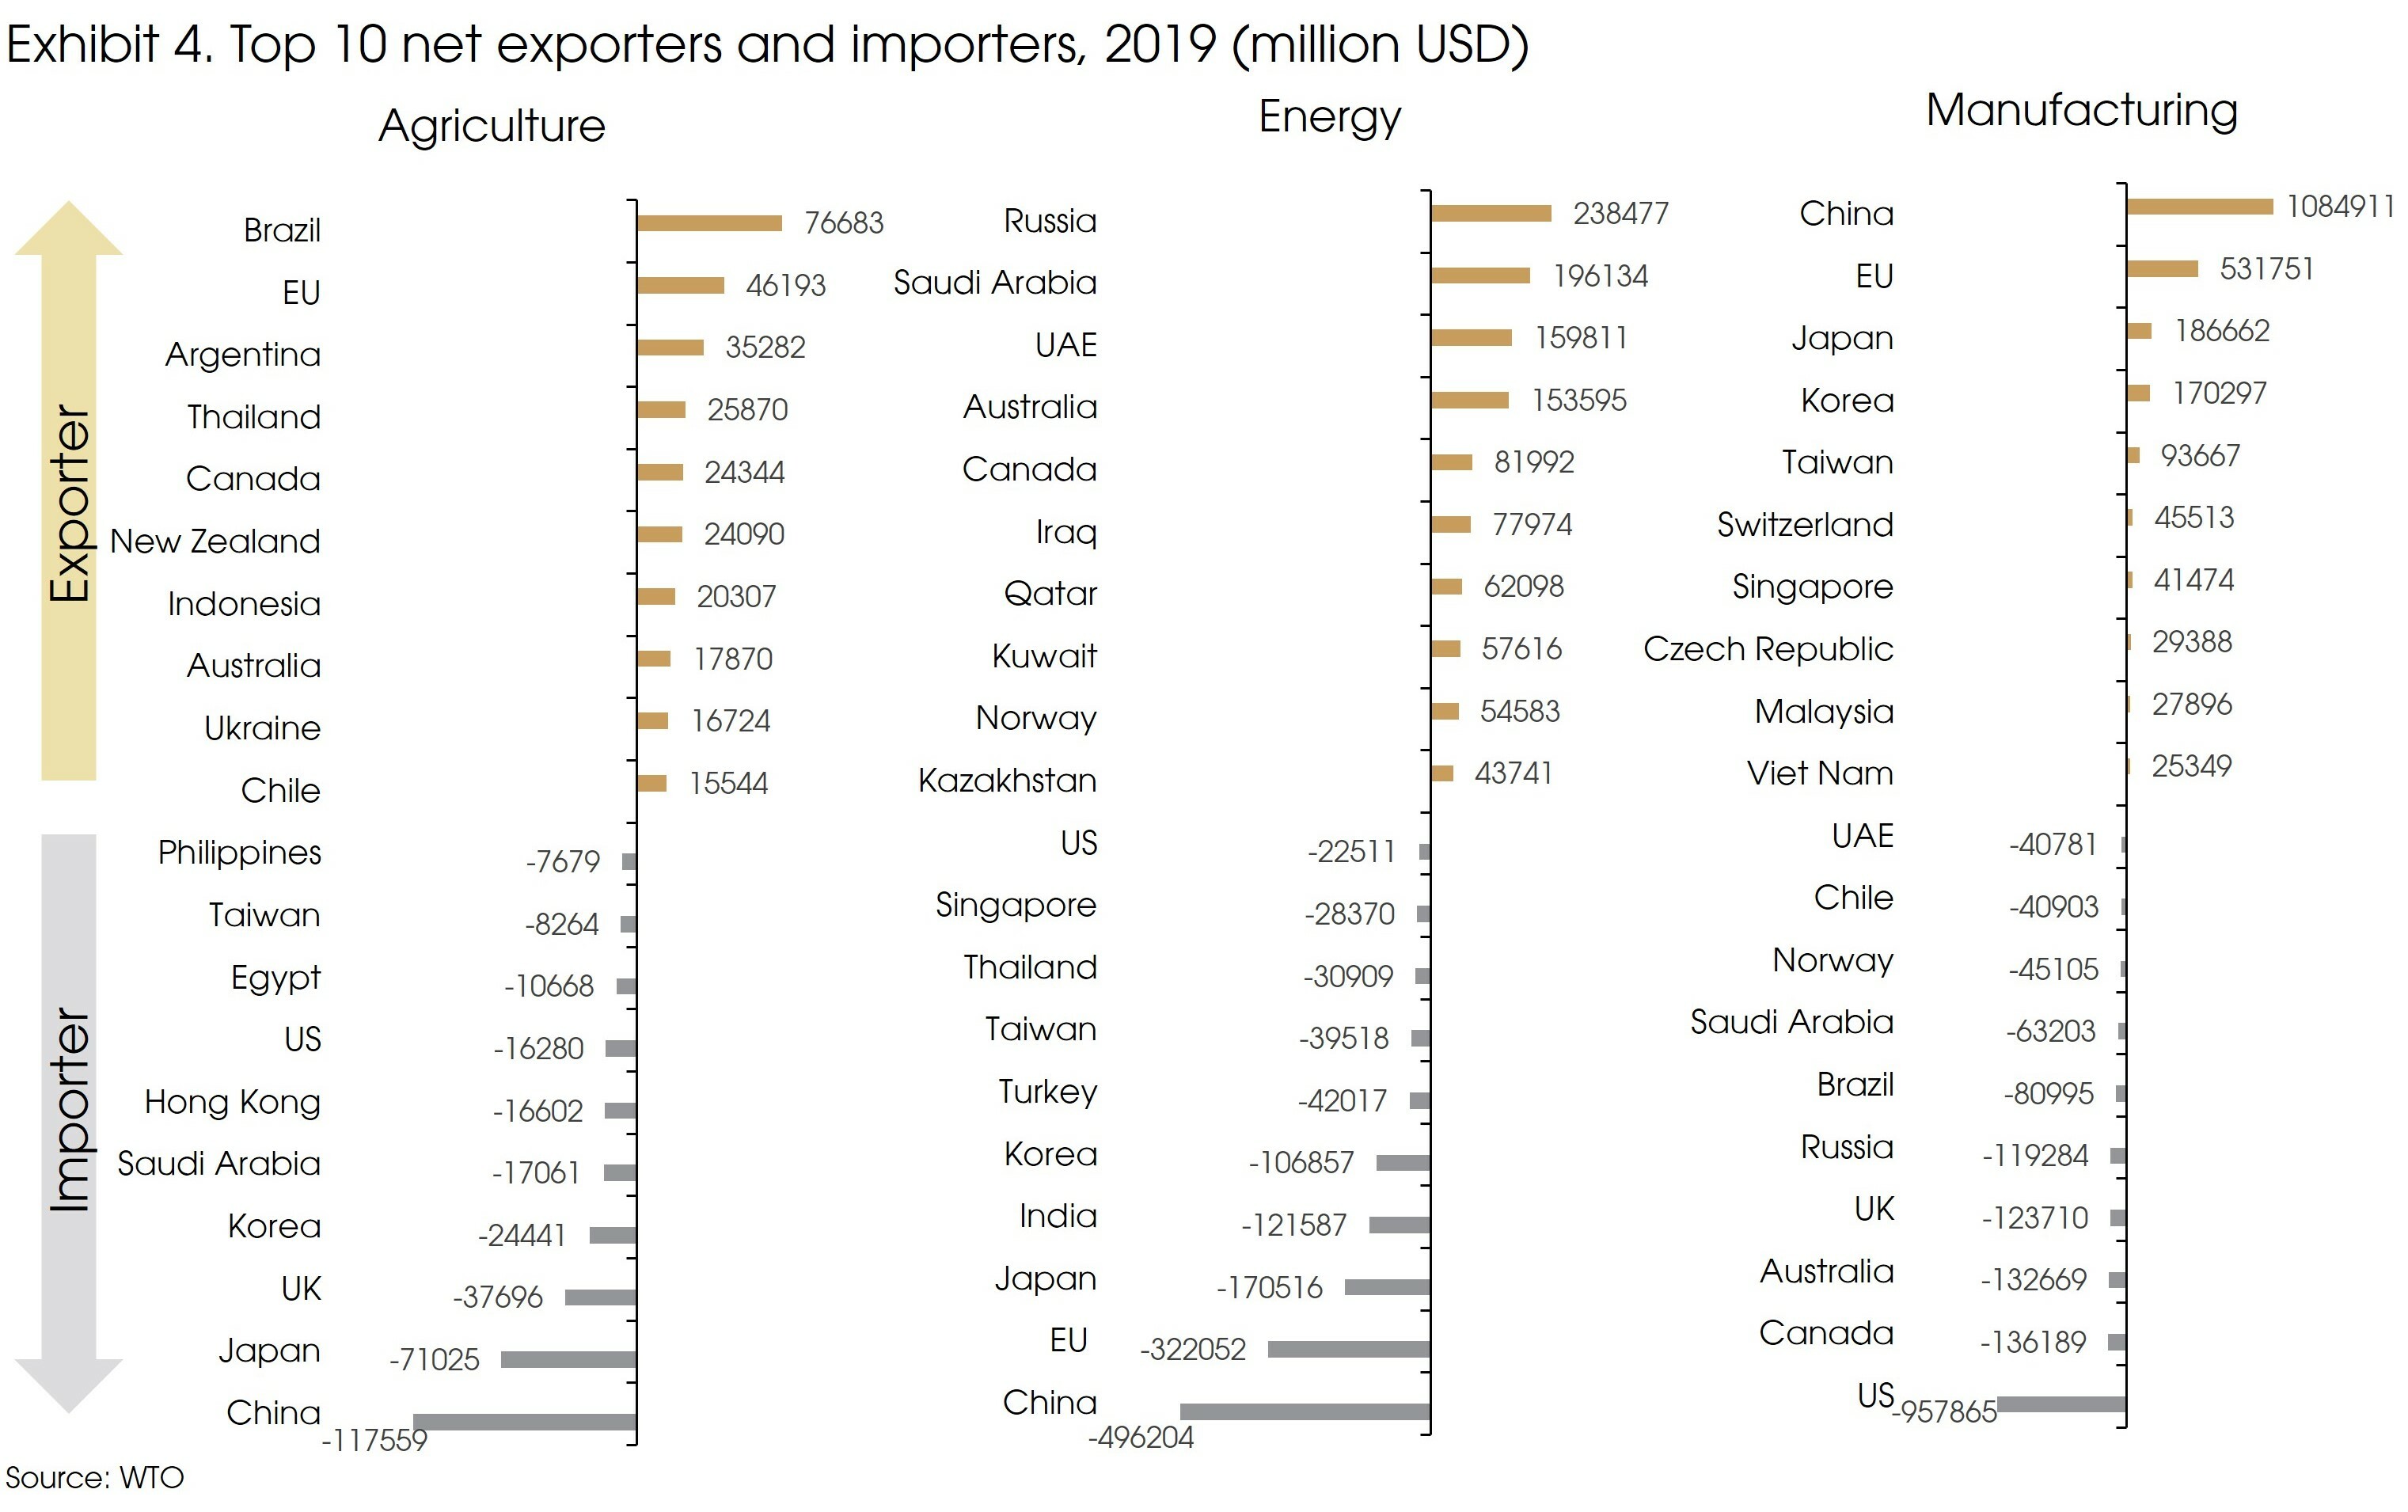
A more granular view on the trade patterns at specific regions and sectors shows several changes during the past decade, driven by a number of forces, such as the changing supply-demand balances, shifting cost advantages, and trade policies.
For example, the US has shifted from an agricultural net exporter in 2008 to a net importer now, primarily driven by the increased domestic demand. The EU turned from a once-large agricultural importer in 2008 to a net exporter, due to its Common Agricultural Policy. Vietnam successfully evolved from a manufacturing importer to a top 10 exporter, as part of production capacity were shifted from China for lower costs.
Such changes suggest that countries and enterprises have always been thinking about improving their supply chains and taking advantage of potential new opportunities regardless of protectionism.
However, supply chain reconfiguration is difficult, costly, and takes considerable time. This explains why trade patterns have remained relatively stable at the macro-level.
Nonetheless, the pandemic and Russia’s invasion of Ukraine could suggest a more turbulent geopolitical and economic landscape in the future, compared with the past decade(s). Economies could be subject to huge volatility if shocks were global and correlated. The question is: How to respond to these new vulnerabilities.
We see three potential shifts.
First, we expect further diversification of trades rather than erecting barriers or isolation. According to a study by World Bank, countries that are less integrated in the global supply chain are more fragile to supply chain shocks or anti-trade policies.
For example, during the early stage of the pandemic, many economies (such as the US and the EU) intended to impose export controls on key medical products. Switzerland and Canada successfully fought against such intentions by leveraging their weights in the supply chain, as they hold key inputs in making these products.
Therefore, instead of deglobalization or reshoring, there could be a greater focus on diversifying suppliers and stockpiling essential inputs. According to the IMF, diversification can almost reduce a supply shock’s impact on the economy by half across all regions (developed or developing).
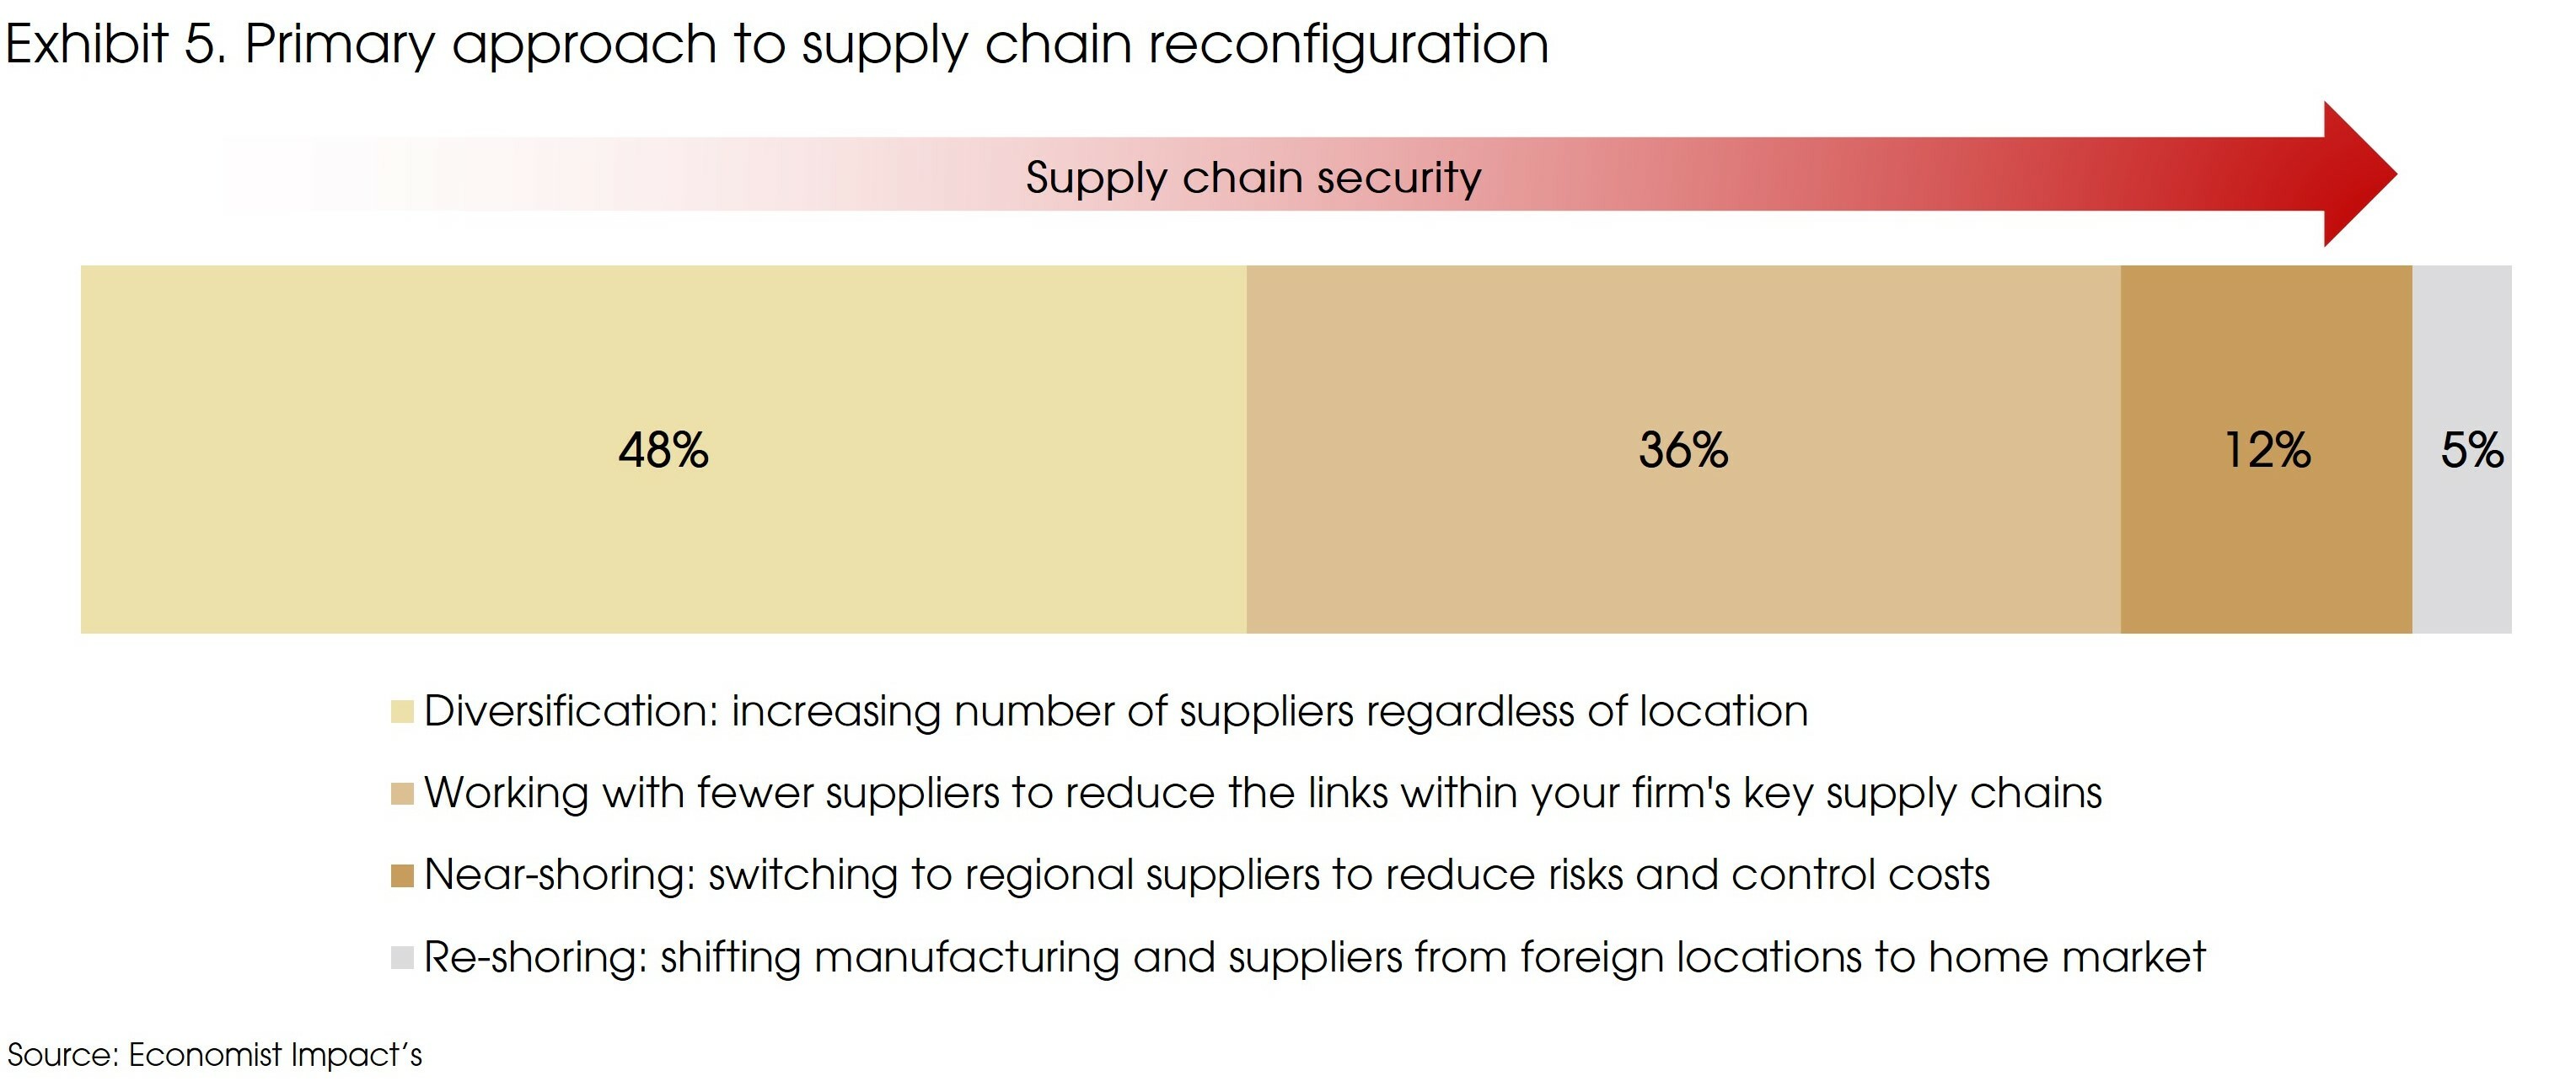
According to the survey by Economist Impact on 3000 executives last year, 83% firms were in the process of reconfiguring their supply chains. Among these, 48% were diversifying their supplier base, compared with only 5% were re-shoring (Exhibit 5).
However, diversification has limits. Therefore, we also expect to see a second shift of near-shoring or friend-shoring, or even reshoring for specific sectors, as countries and enterprises prioritize security over efficiency.
In recent years, there is a shift towards new industrial policies, mainly led by China and the US, as geopolitical tensions have affected strategic supply chains. The US administration has explicitly identified “friend-shoring” as a policy goal. This could benefit countries such as Colombia in South America, Saudi Arabia in the Middle East, and Vietnam in Asia.
For strategic industries such as semiconductors or pharmaceuticals, the very limited reshoring of supply chains so far may change as a result of public policy.
The CHIPS act of the US aims to provide more than USD 50 billion to strengthen domestic manufacturing of semiconductors. The FABS Act will provide tax credits to semiconductor manufacturing companies.
Similarly, the European Chips Act also aims to mobilize EUR 43 billion of public and private investment into the European semiconductor sector by 2030, and targets to more than double EU’s production capacity share from 8% to 20%.
The third shift is Regionalization. Achieving greater security (either from near-shoring or re-shoring) has a price due to lower international risk-sharing and higher transitional costs. Regionalization allows countries to re-generate some economies of scale and risk-sharing to limit such costs.
Regionalization is not a new phenomenon, the EU, ASEAN, and many other multilateral trade/investment agreements (e.g., CPTPP, RCEP) are all good examples. During the recent decades, regionalization has gone hand-in-hand with faster globalization. Looking forward, however, we may see diverging forces: Fragmentation at the global level may promote further integration at the regional level.
Ultimately, history shows that global trade grows in sync with economic growth. It pulls back in recessions and grows during expansions. Deglobalization is not a trend yet, but the risk is increasing. To deal with the risk, we expect countries and enterprises to further diversify their supply chains, develop regional cooperation, and promote innovation, rather than setting more barriers to isolate themselves.
Potential production diversifications in the semiconductor sector
The semiconductor sector has been the center of focus since 2018, when the US imposed export bans on US chip makers selling to Chinese entities.
Over the past three decades, geographic specialization based on regions’ comparative advantages have resulted in a highly concentrated and interdependent global semiconductor supply chain (see our previous Focus for more details).
For example, there are more than 50 points across the overall supply chain where a single region accounts for 65% or more of the total global supply.
Such an excessive geographic concentration exposes the industry to single points of failures that could be triggered by natural disasters, cyberattacks, or geopolitical frictions.
Regarding the resilience of the semiconductor value chain, manufacturing is clearly a major concern. Currently, almost 75% of the global installed capacity is in East Asia (Japan, South Korea, Taiwan, and mainland China). The capacity concentration is even higher for advanced technologies: 100% of the global capacity in the leading 7 and 5 nanometer nodes is in East Asia.
However, the region is significantly exposed to geopolitical tensions. In an extreme case of complete disruption in Taiwan for a year, the Taiwanese foundries would lose their current USD 42 billion in revenues. This would also cause a USD 490 billion loss in revenues among electronic device makers in the world (equivalent to the total revenue of the entire semiconductor sector in 2019, according to BCG).
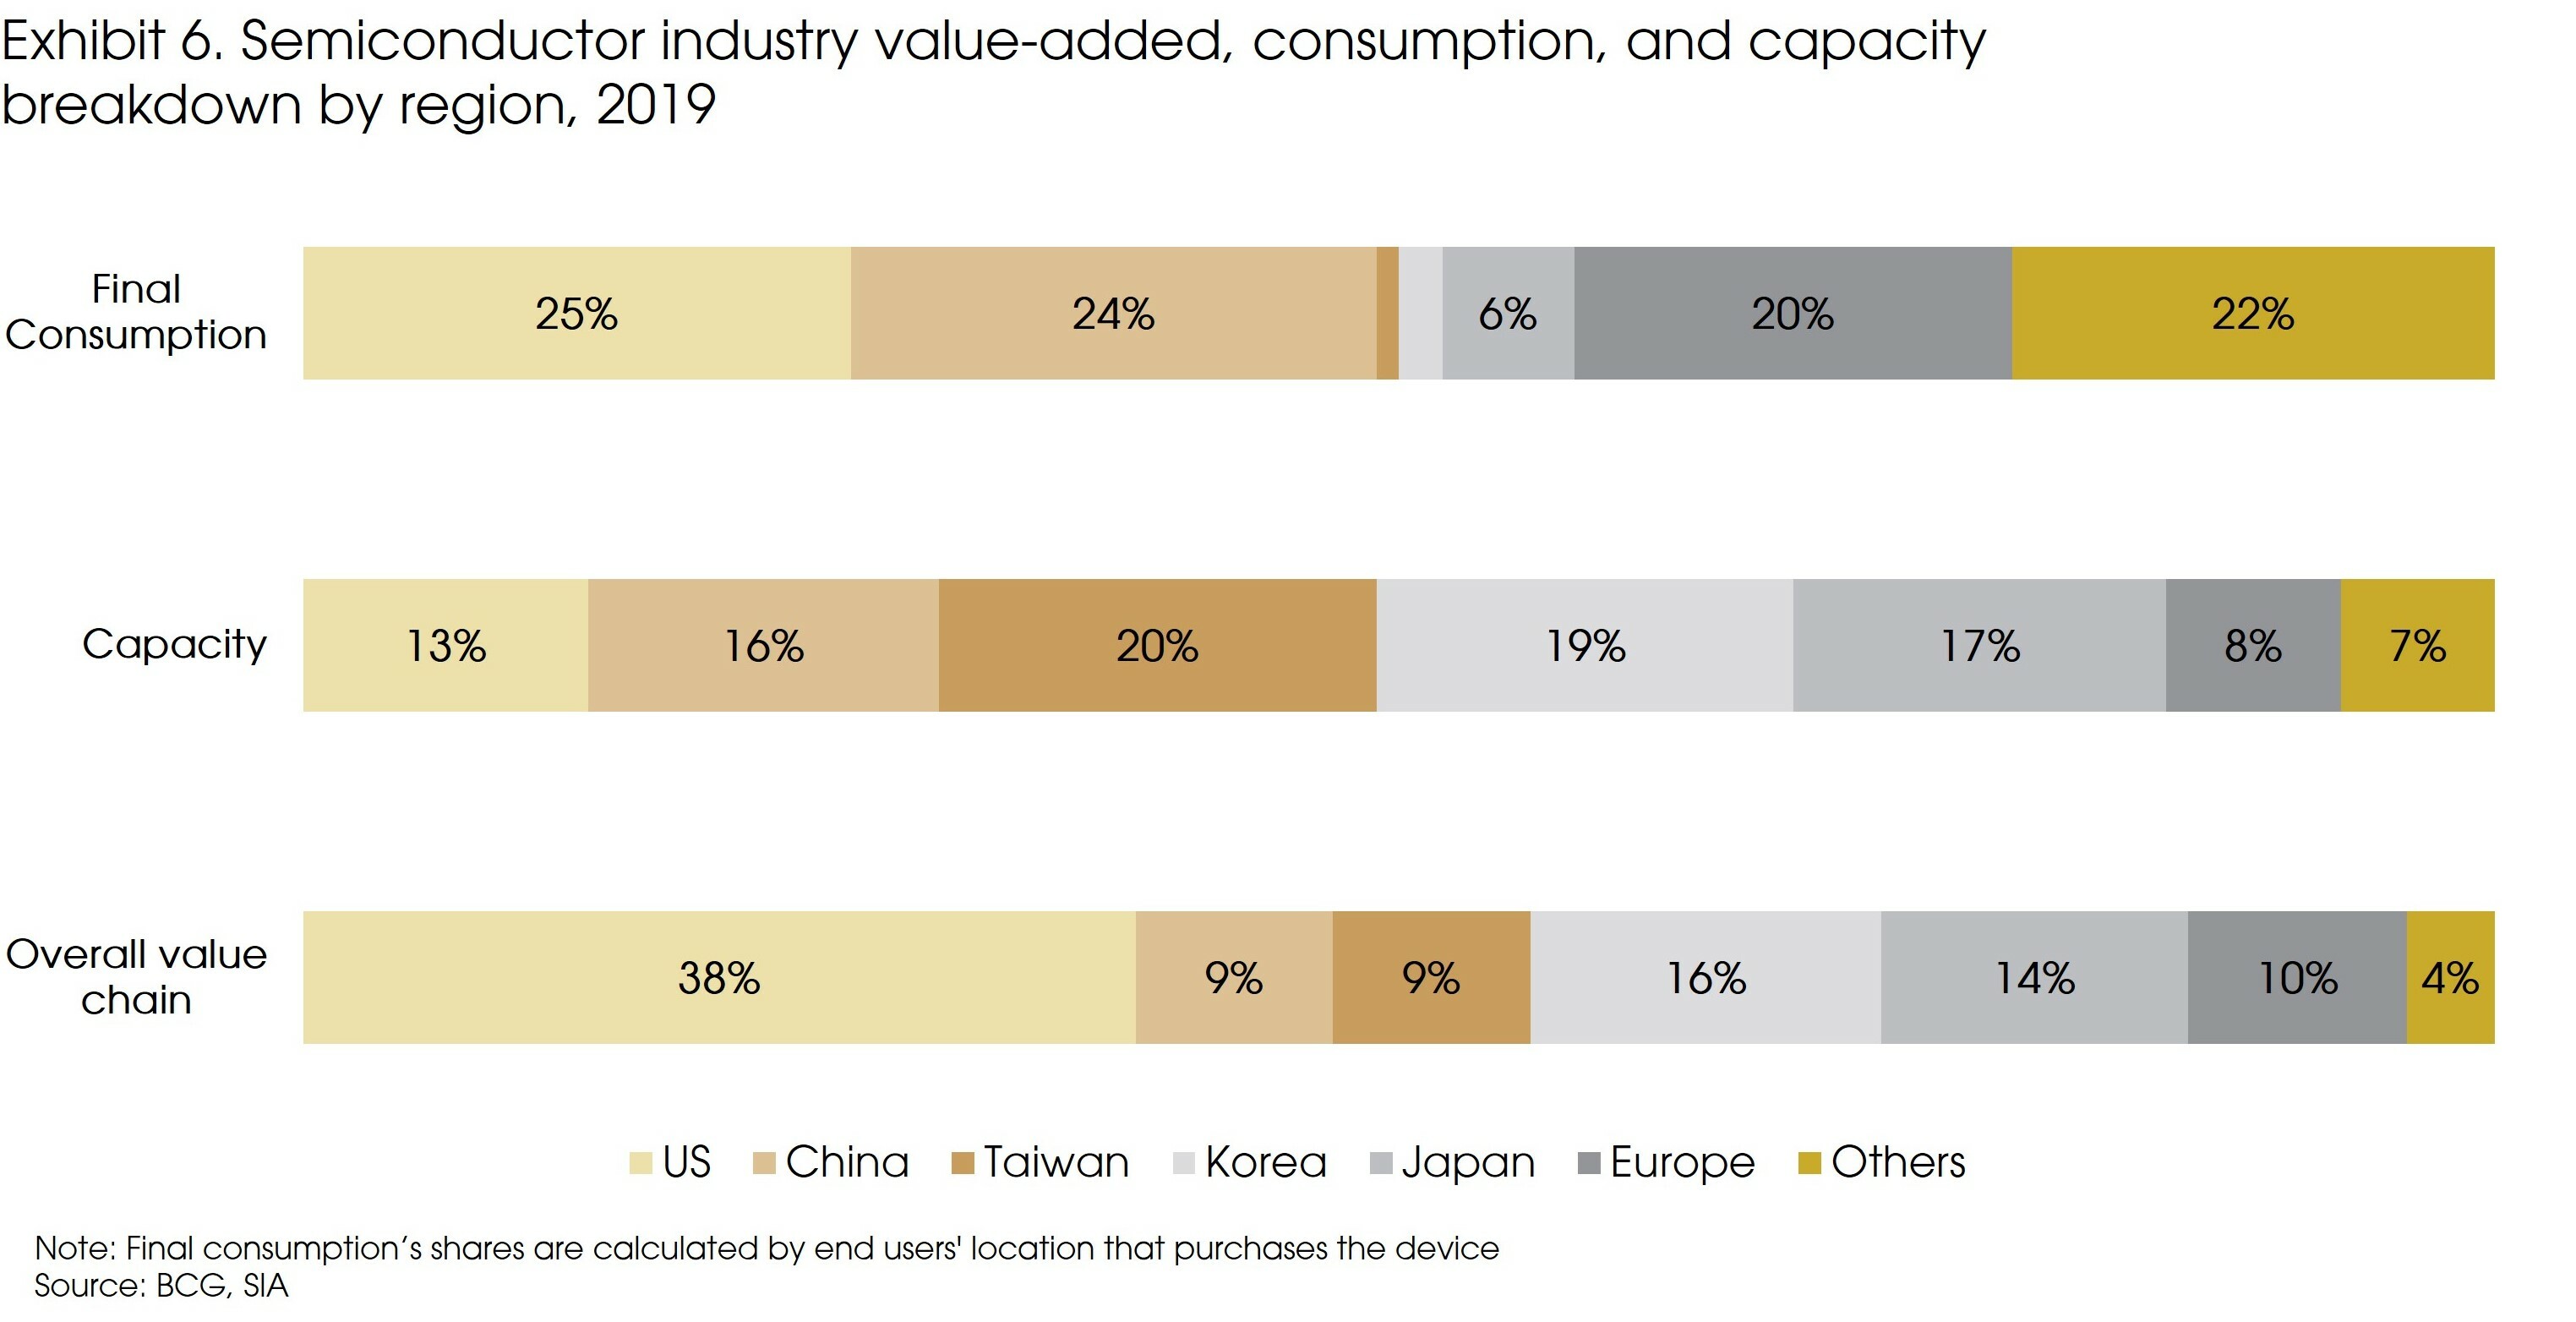
In addition, such a high concentration of production capacity has increased the risk for end market consumptions in regions, such as the US and EU (Exhibit 6). Both regions account for more than 20% of final consumption, but only around 10% of production.
The solution to such challenges, however, is not to achieve complete manufacturing self-sufficiency by trying to cover total domestic consumption with onshore capacity. Specifically, for the US, self-sufficiency would require over USD 400 billion in government incentives, cost more than USD 1 trillion over ten years, and increase the sales price by 35% due to the rising costs. The costly reshoring is unable to eliminate supply risks. The continued reliance on global supply-chains for wafers, chemicals, and certain fabrication tools will still entail frictions during times of rapid changes.
A better way is through diversification. Governments should consider maintaining a minimum viable manufacturing capacity to meet domestic demand in key areas, such as national security systems, aerospace, and critical infrastructure. At the same time, seek to achieve a more diversified geographical footprint, such as expanding the production sites and sources of supply for critical materials. Such a diversification can achieve significant cost efficiency while containing risks.
Diversification of energy supply: the further shift towards renewables
The energy supply chain is also highly concentrated. Unlike the semiconductor sector, it is even harder or almost impossible for many countries to achieve self-sufficiency. After all, energy resources are distributed unevenly around the world, and cannot be substituted with domestic alternatives.
After the oil embargo during the 1970s, the US had been actively seeking for alternative supplies, and managed to increase the extraction rate of shale gas in 2013, thanks to the new technologies. However, not all other countries can follow the similar path.
Further shift towards renewable energy is one way to diversify energy supply. However, even under the “net-zero” scenario where renewable energy accounts for 50% of total energy supply, regions will still have to source the critical inputs for renewables (e.g., copper, cobalt, and nickel) from a small pool of potential suppliers. A new geopolitical race to secure access to these resources is therefore likely.
A long-term tailwind for Agriculture Technology
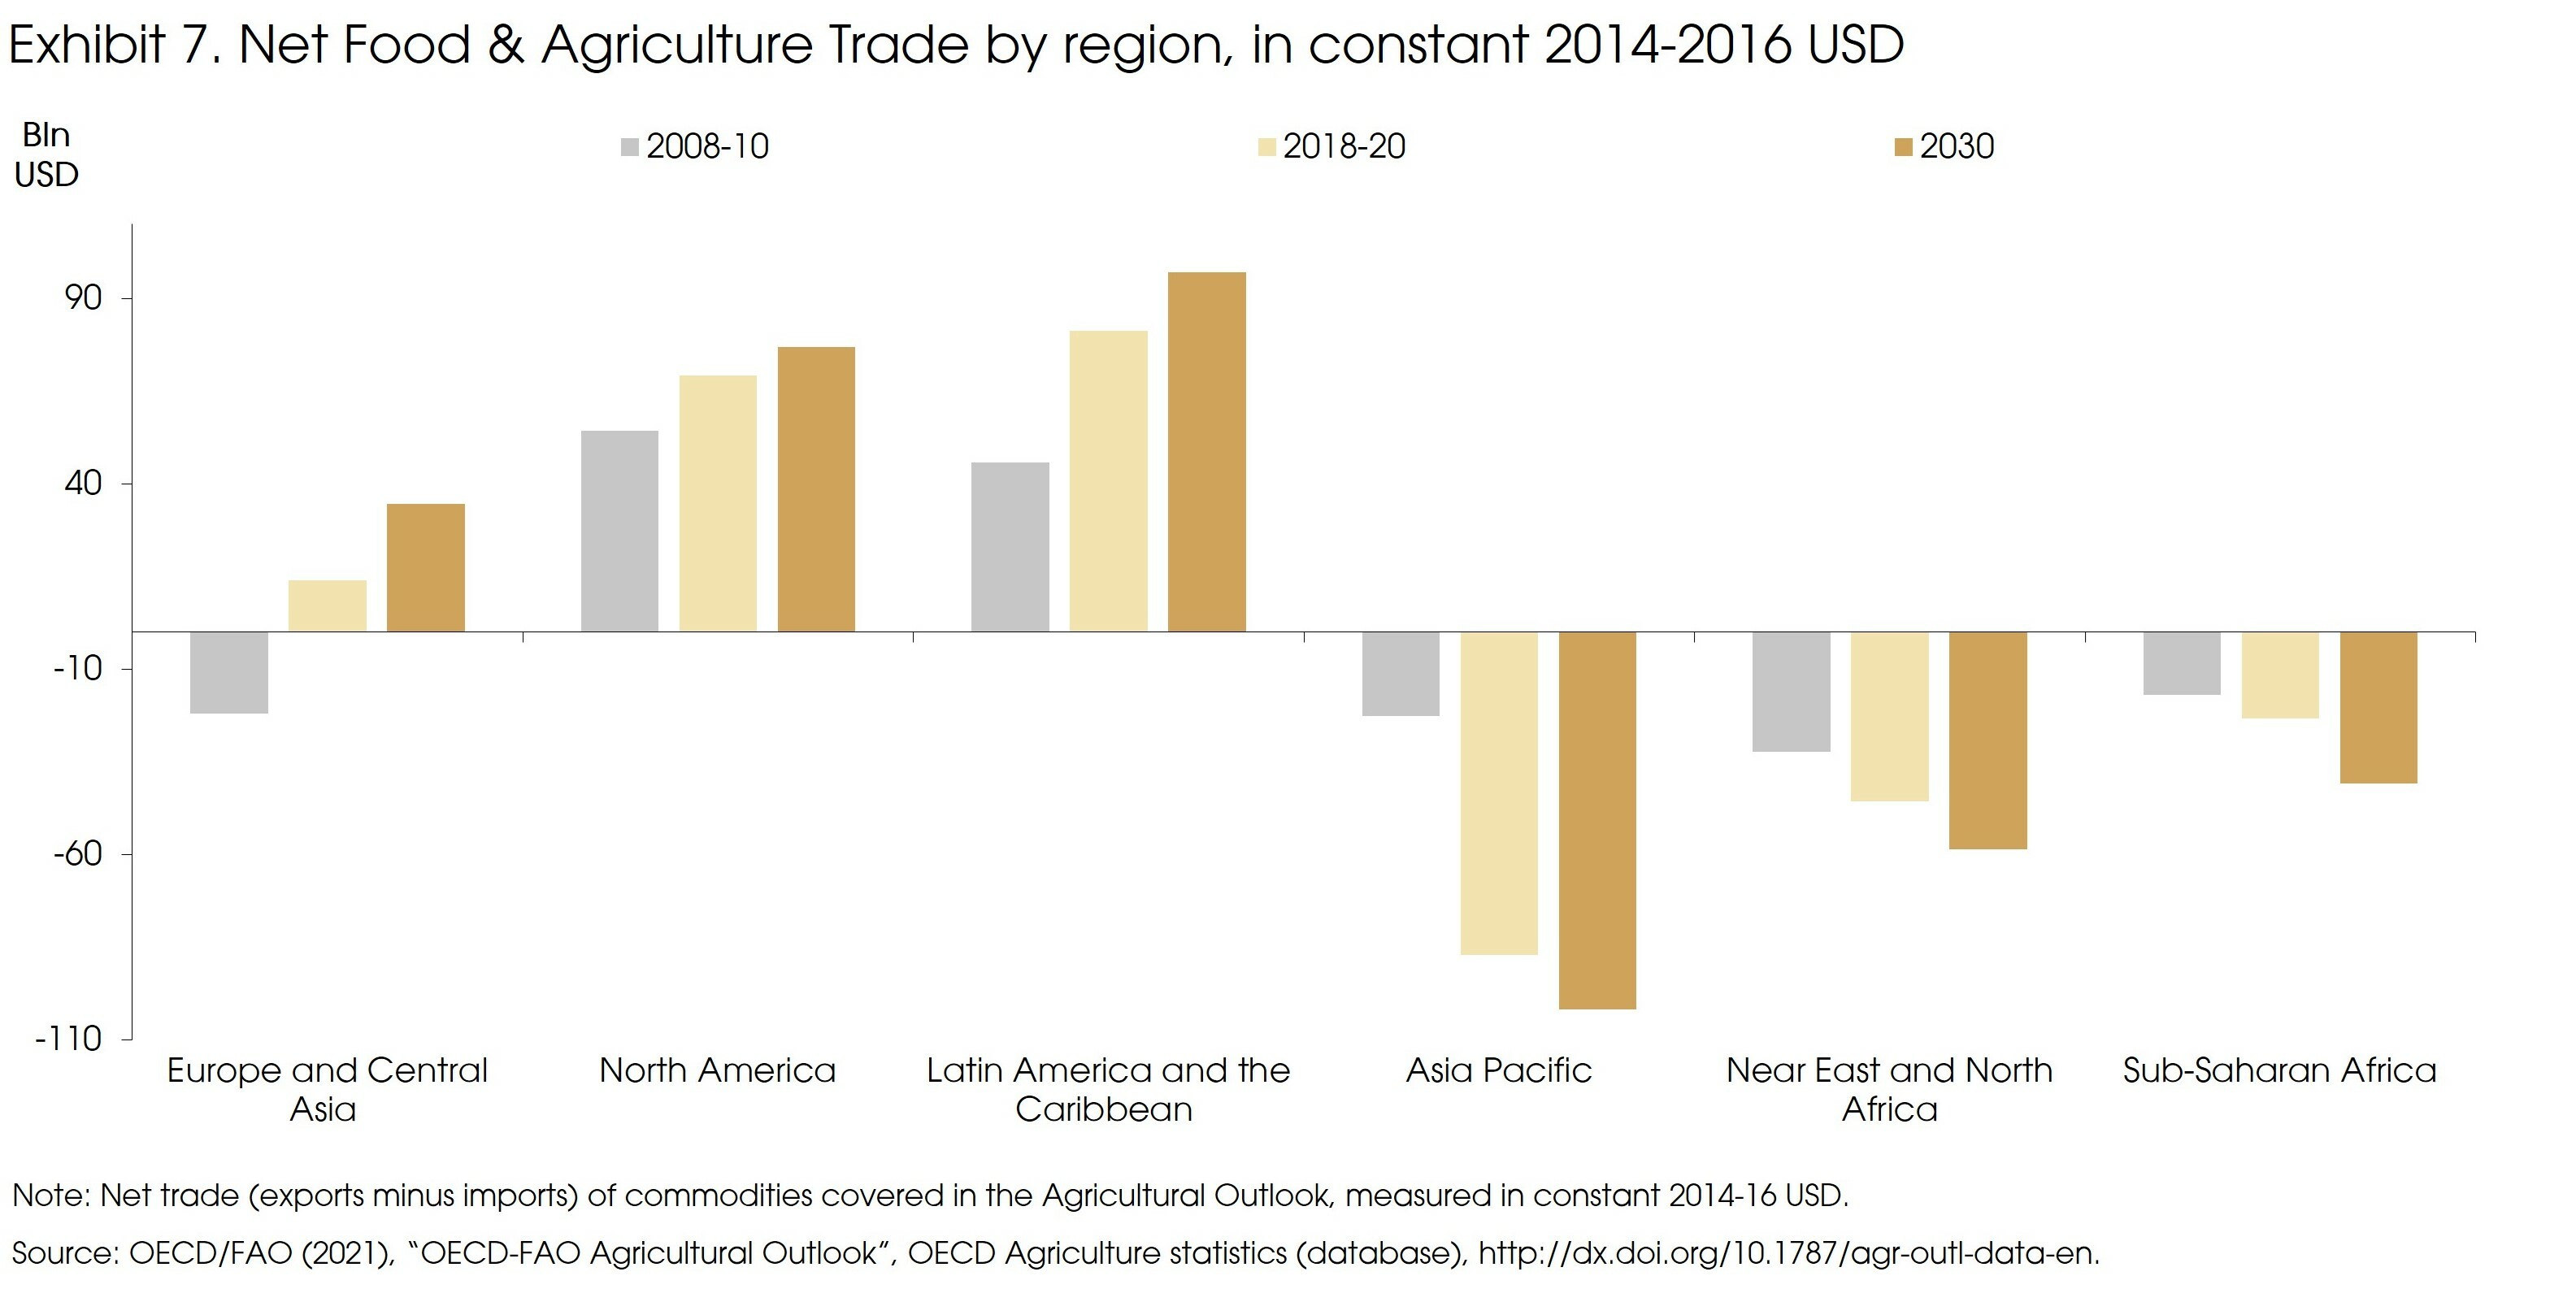
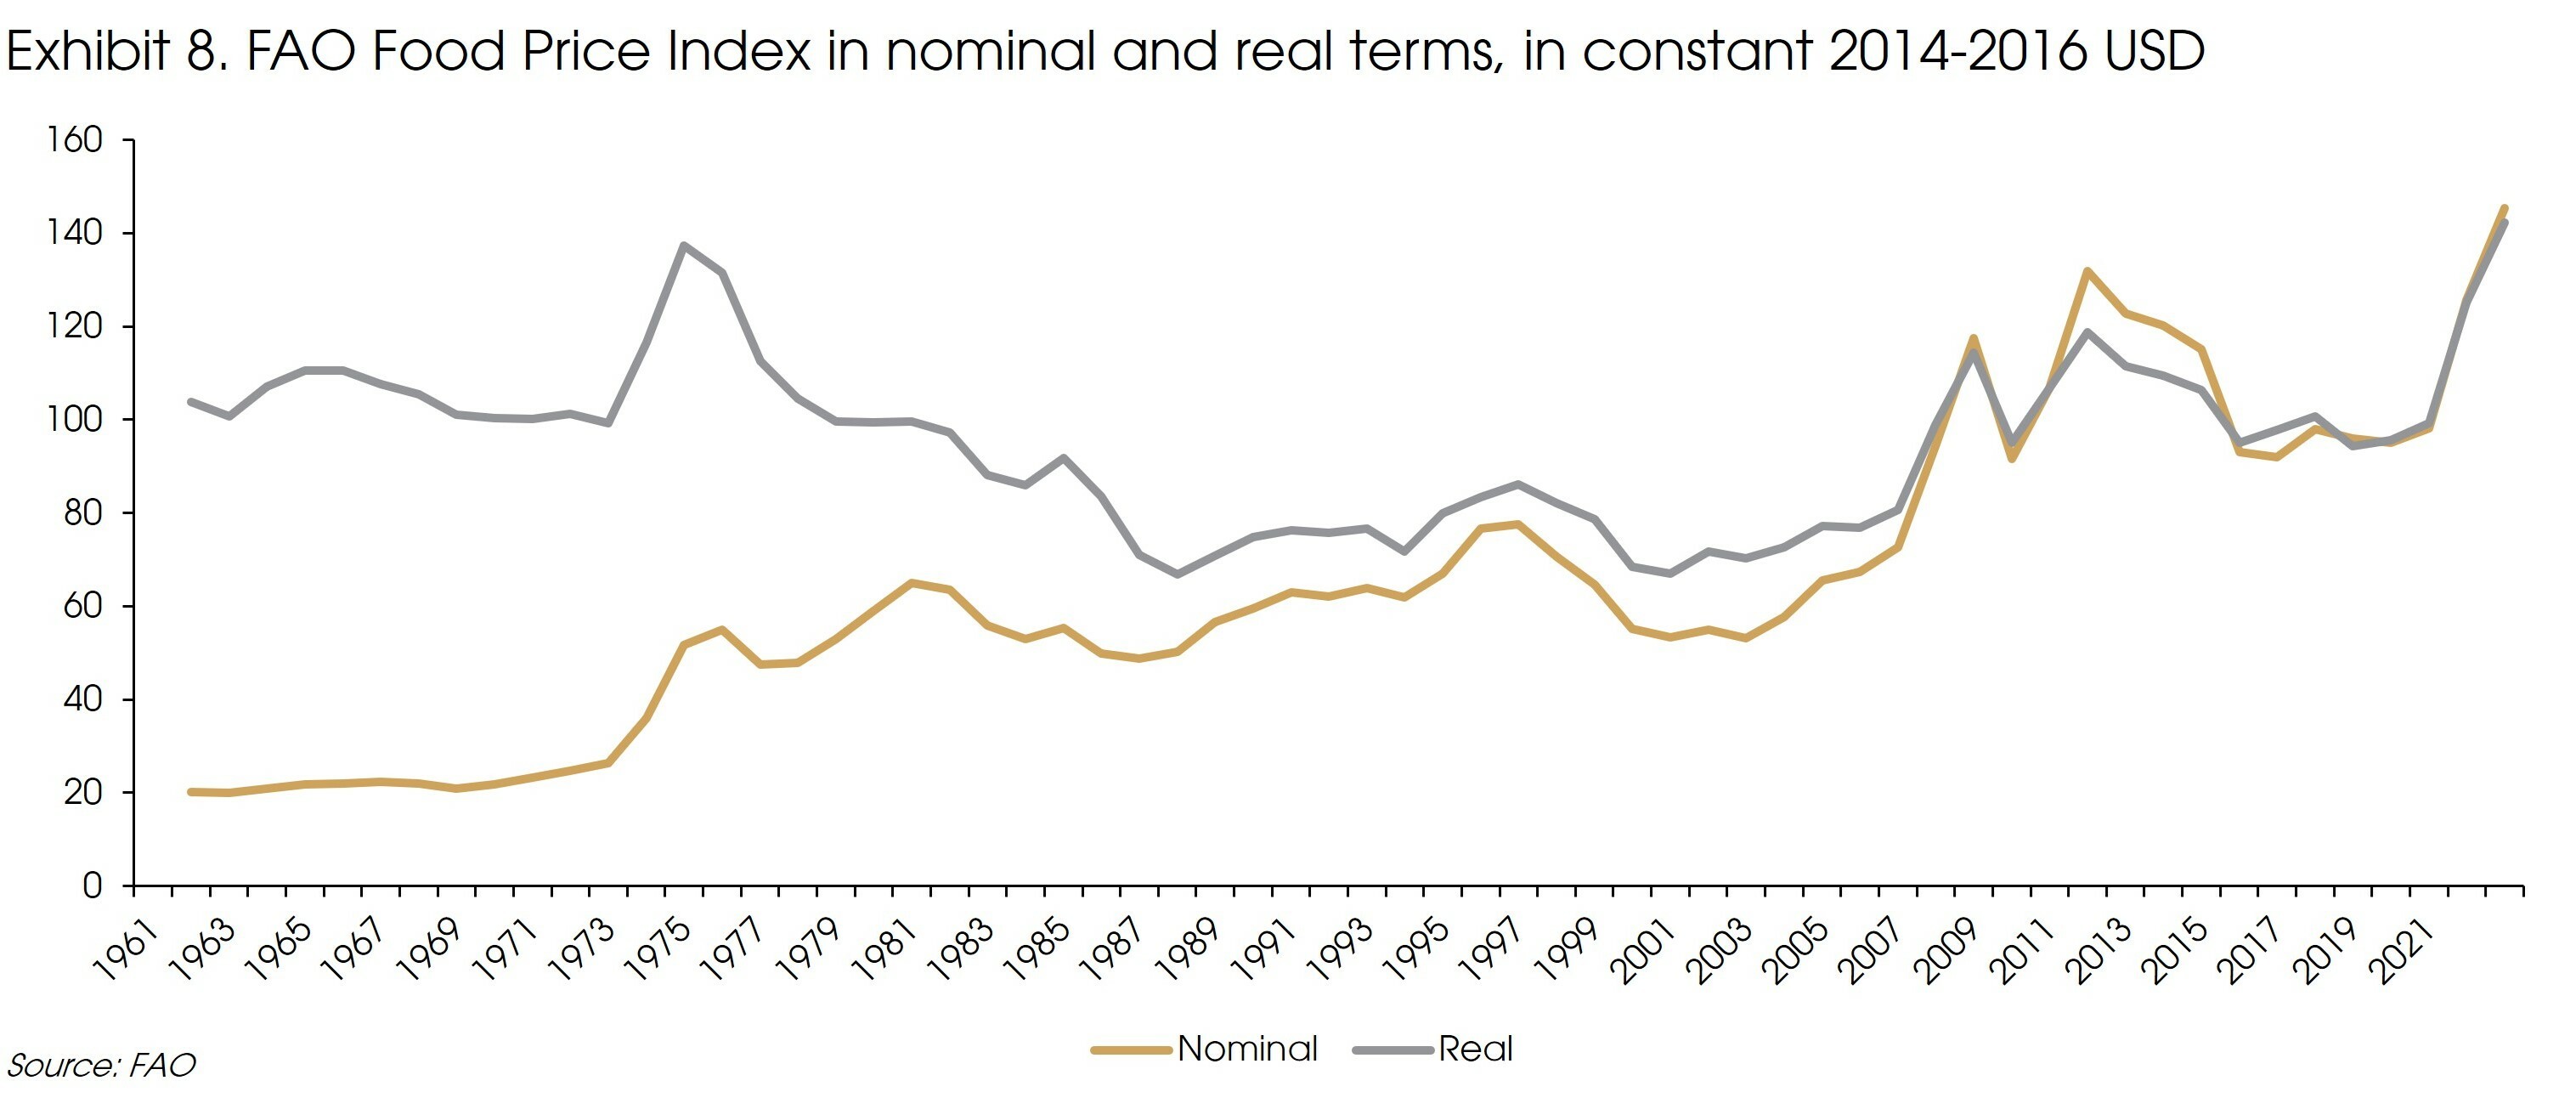
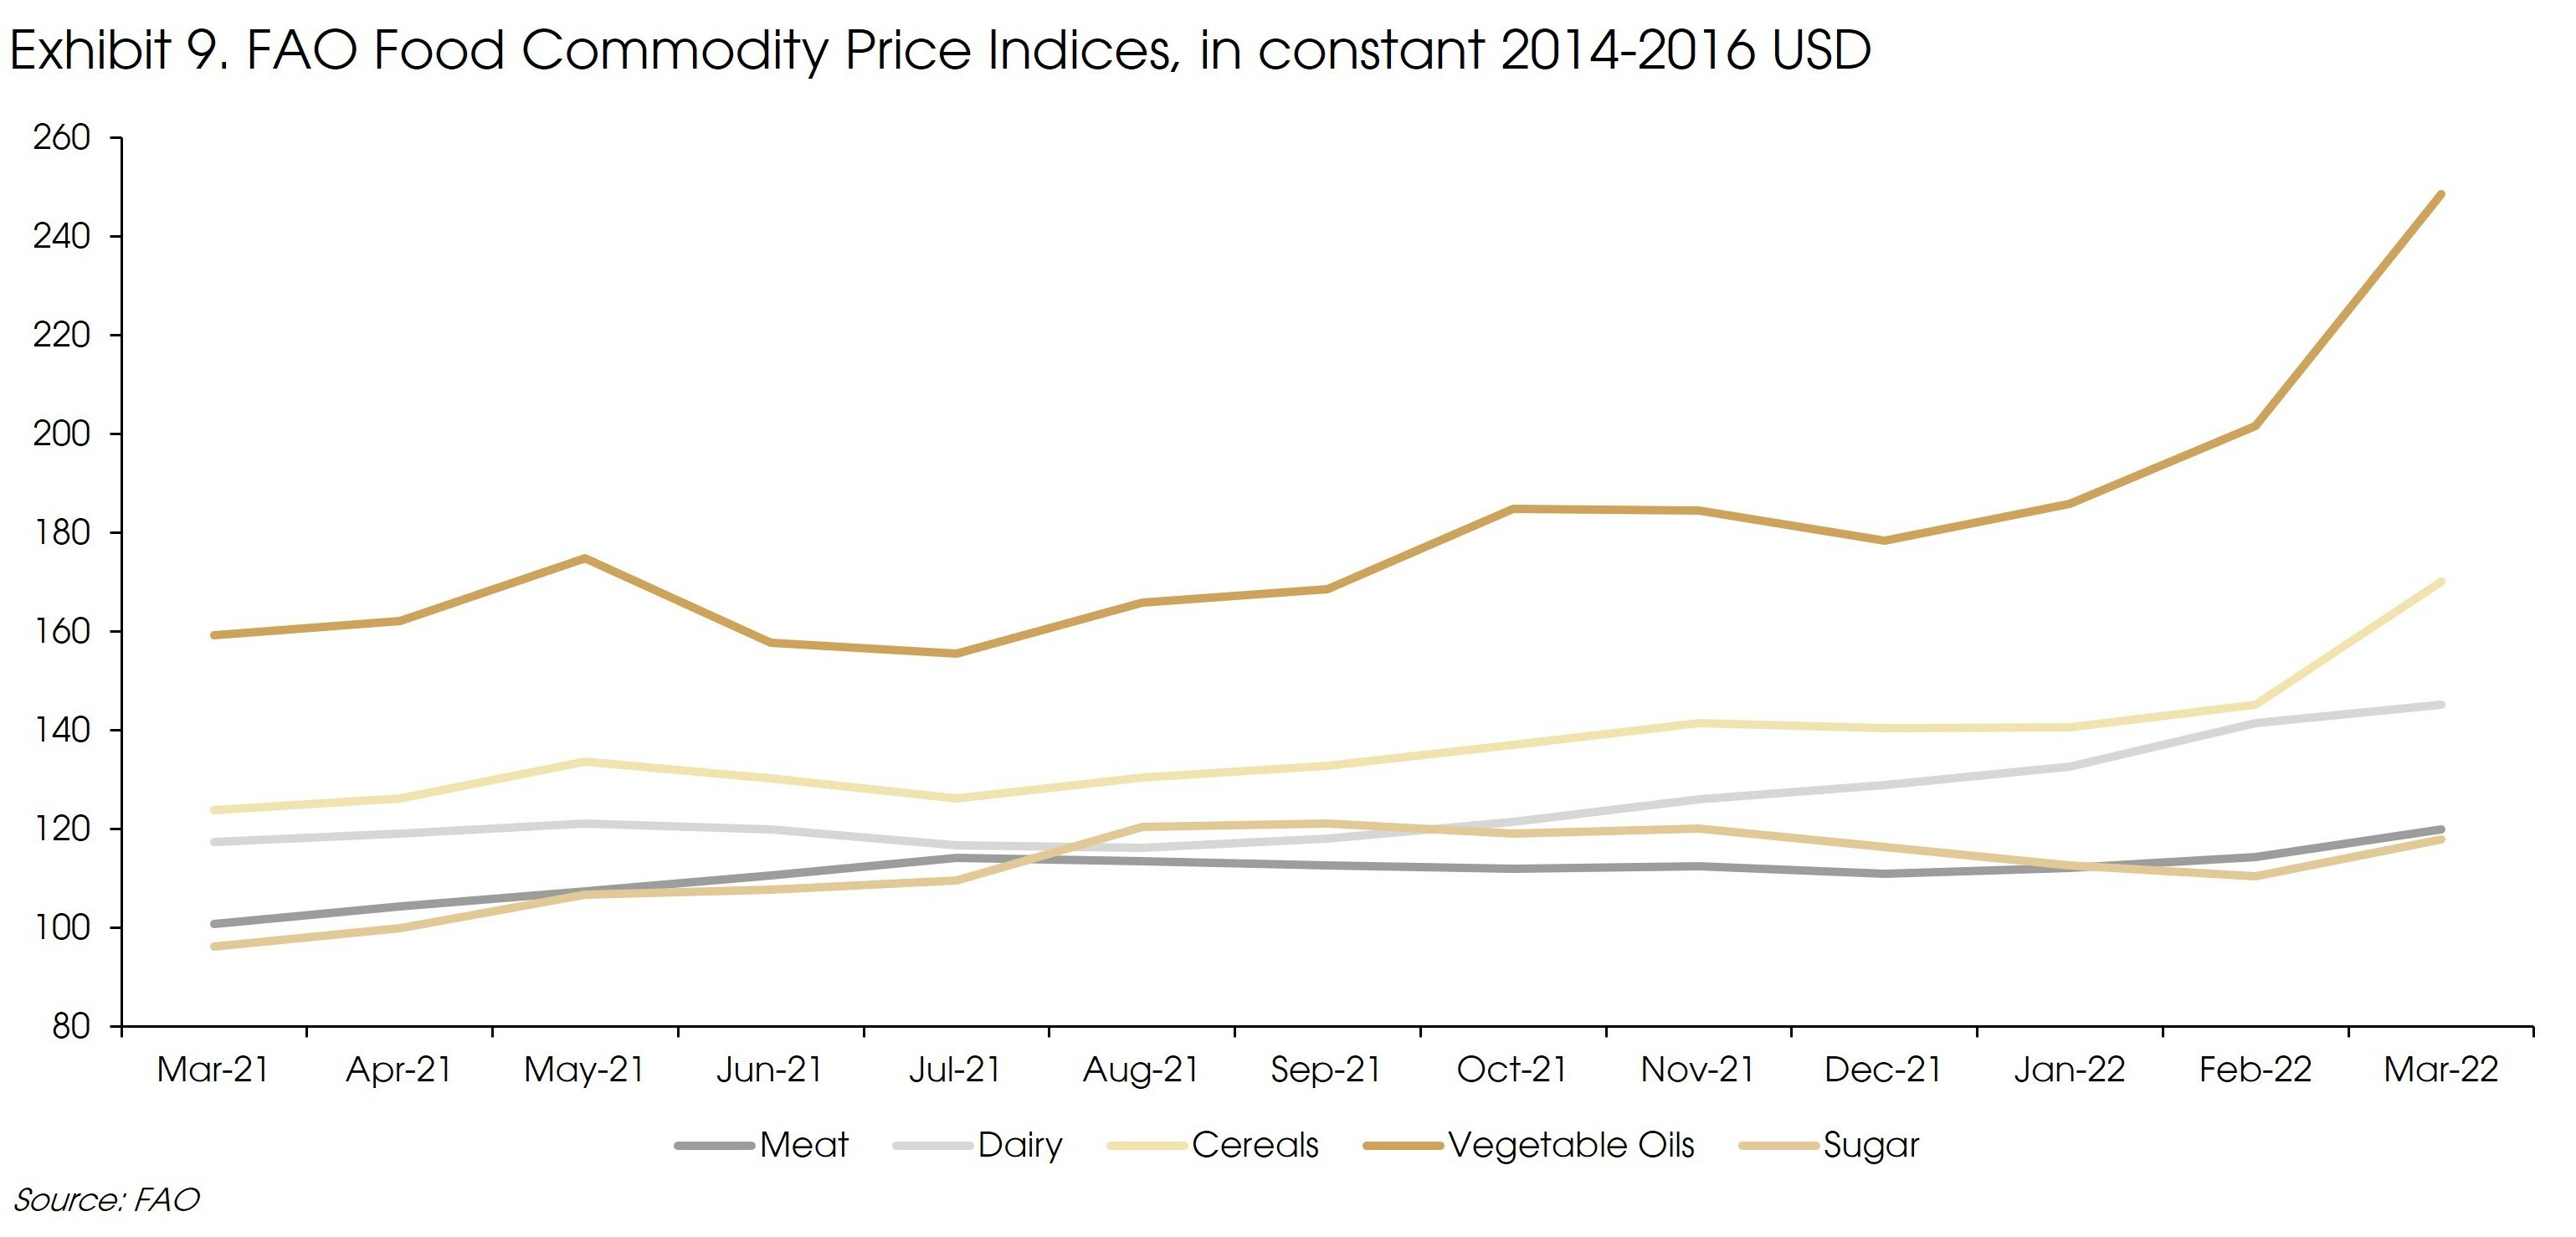
However, with recent events of the COVID-19 pandemic and the Russia/Ukraine conflict, calls for a greater reliance on national production for F&A and more resilient supply chains are being made. Food security has become an immediate but also long-term area of concern, both on supply sufficiency and food price stability. Exhibit 8 and 9 reveals the FAO food price index had its highest month-on-month increase in March since its inception in 1990, driven by all-time highs for vegetable oils and cereals due to the expected export loss from Ukraine and Russia and economic sanctions such as trade quotas and bans. China also increased import demand, thereby contributing to price increases due to a loss of output from its strict lockdowns.
Governments and international organizations are left pondering how to mitigate such events from threatening food security further. In the short-term, solutions point towards increasing food reserves and transparency of global food production and supply. One such platform existing today is the Agricultural Management Information System, managed by the FAO, which is designed to share information on global supply and demand so as to avert overreactions to economic and geopolitical events and stabilize trade factors.
In the long run, this may act as a tailwind for Agriculture Technology (AgTech) to increase productivity and production resiliency. Advancements such as vertical farming allow for agriculture in controlled environments, which may not only increase efficiency, but potentially allow for new crops to be produced in more regions, diversifying the production base and mitigates risks of climate change. However, the technology is still early and concentrated in developed markets. 60% of VC investment is focused on North American firms over the past decades, while demand growth will come more from APAC and African regions in the coming decade. It will also take time for these advancements to scale and become economically viable, hence more investment and policy support is needed to accelerate the industry. Perhaps, recent geopolitical and economic events may act as the needed catalysts for AgTech to strengthen food security and open an opportunity to invest amidst the deglobalization risk.
A final word on the dollar. The dollar's rise has coincided alongside the growth of global trade. These dollar denominated assets are seen as safer being backed by the US rule of law. The rising deglobalization risks and the dramatic sanctions imposed on Russia have significantly shaken such fundamental values of the dollar. The financial war on Russia suggests that the dollar assets are not “safe” anymore. Therefore, although it is far too early to predict any decline of the dollar dominance, there could be mild but long-lasting consequences in the global financial system. For example, countries like China may further shift its dollar reserve to gold or other tangible assets, such as key materials.
Sources: BBAC, BCG, CICC, Economist's Impacts, FAO, Mercedes-Benz Group, SIA, World Bank, WTO, CIGP Estimates


